
At what age should a person retire?
Sixty?
Sixty-five?
Sixty-seven?
There is no global answer.
Across the world, public pension systems use dramatically different retirement ages—and even inside a single country the answer can depend on your birth year, sex, career length, profession and contribution history.
The United States has moved to a full Social Security retirement age of 67 for people attaining age 62 in 2026. Australia’s Age Pension age is also 67. Canada’s standard Canada Pension Plan age remains 65, although benefits can be started earlier or deferred. Japan’s standard public pension age is 65. (Social Security Administration)
Then there are countries such as Poland, Brazil and China, where one number cannot adequately describe the system.
That is why a world retirement-age map is useful—but only if we understand what it is actually showing.
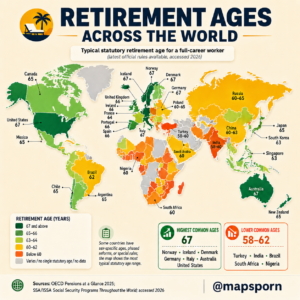
There Is No Single Definition of “Retirement Age”
This is the most important point behind the entire map.
A country can have several different ages that people casually call “retirement age.”
There may be an early pension age, when benefits become available but are reduced.
There may be a normal pension age, when someone with a typical full career receives benefits without a penalty.
There may be a statutory old-age pension age.
And there may be an entirely separate age when an employer is allowed—or required—to end someone’s employment.
These are not always the same.
The United States is a good example.
Social Security retirement benefits can normally begin as early as 62, but claiming early permanently reduces the monthly payment. For people attaining age 62 in 2026, the full retirement age is 67. (Social Security Administration)
So is the U.S. retirement age 62 or 67?
Both numbers can be correct depending on the question.
OECD Countries Average Around the Mid-60s
For people retiring after a full career, OECD data show that the average normal retirement age in 2024 was:
64.7 years for men
and
63.9 years for women.
Among OECD countries, some of the highest current normal ages were 67 in Denmark, Iceland and Norway, while many other countries clustered between roughly 64 and 66. (OECD)
But the long-term trend is clearly upward.
For someone entering the workforce at age 22 in 2024, the OECD estimates that under legislation already enacted, the eventual average normal retirement age will rise to roughly:
66.4 for men
and
65.9 for women. (OECD)
In other words, today’s young workers may face retirement ages several years higher than today’s retirees.
United States: 67 Has Become the New Full Retirement Age
The map’s 67 for the United States is reasonable if it means Social Security’s full retirement age for younger cohorts.
The Social Security Administration confirms that 67 is the current full retirement age for people attaining age 62 in 2026. (Social Security Administration)
People can still claim Social Security at 62.
But there is a trade-off.
Claim early and your monthly benefit is lower.
Delay past full retirement age and your monthly payment can increase up to age 70.
So retirement age in the United States is increasingly less of a single fixed date and more of a financial decision.
Canada: 65 Is the Reference Point, Not a Deadline
Canada is shown at 65, and that works as the standard benchmark.
Canada Pension Plan retirement benefits use 65 as the standard reference age.
But Canadians can begin CPP as early as 60 with a permanently reduced payment or delay it as late as 70 for a higher monthly benefit.
This reflects a broader trend in modern pension systems:
Governments increasingly provide a retirement window rather than one mandatory retirement birthday.
Australia: 67
Australia is one of the countries where the public pension eligibility age has already reached 67.
People born on or after January 1, 1957 generally need to be 67 to meet the Age Pension age requirement. (Services Australia)
This is one reason Australia sits among the darkest green countries on the map.
New Zealand: 65
Across the Tasman Sea, New Zealand takes a different approach.
Eligibility for New Zealand Superannuation begins at 65 under current law. (Ministry of Social Development)
Two neighboring high-income countries therefore have a two-year difference in their principal public pension ages.
That alone shows that retirement age is not determined simply by life expectancy.
Political choices matter too.
Northern Europe Has Some of the Highest Ages
Northern Europe contains many of the map’s highest values.
OECD data give a normal age of 67 for Denmark, Iceland and Norway. (OECD Data Explorer)
These countries combine long life expectancy with extensive welfare states.
That creates a difficult equation.
If people spend more years receiving pensions while the working-age population grows more slowly, governments must find a way to finance those benefits.
They can raise taxes.
Reduce pensions.
Increase contributions.
Encourage immigration and employment.
Or increase the age at which pensions are paid.
Many governments are using some combination of all of those measures.
Germany: 67 Is the Destination, Not Yet Everyone’s Current Age
The map shows Germany as 67.
That is where Germany’s regular pension age is heading, but it needs a qualification.
In 2026, someone from the 1960 birth cohort reaches the standard pension age at:
66 years and 4 months.
The threshold continues increasing by two months for each subsequent birth cohort until it reaches 67 for people born in 1964 or later. (Deutsche Rentenversicherung)
Germany also allows some people with exceptionally long contribution histories to retire earlier without the normal penalty.
So even here, “retirement age 67” compresses several rules into one number.
Italy: 67 Is Correct for the Standard Old-Age Pension
Italy is one of the clearer cases on the infographic.
For 2026, the ordinary old-age pension age is 67, generally with at least 20 years of contributions. (INPS Official Site)
Italy is especially interesting because the country combines:
an ageing population,
very low fertility,
and long life expectancy.
Those demographic pressures are likely to keep pension reform high on Italy’s political agenda.
Indeed, Italian authorities have already legislated another adjustment: the standard age will become 67 years and 1 month in 2027 and 67 years and 3 months in 2028. (INPS Official Site)
Britain Is Moving From 66 to 67 Right Now
The United Kingdom is shown at 66, but that is becoming outdated in real time.
The UK began raising State Pension age from 66 to 67 in 2026.
The transition will continue through 2028.
For people born between April 1960 and March 1961, State Pension age ranges from 66 years and 1 month to 66 years and 11 months. Later cohorts reach 67. (GOV.UK)
A map created in 2026 therefore really needs to show:
66–67
rather than simply 66.
France Shows How Politically Sensitive Retirement Can Be
Few countries demonstrate the politics of pension reform better than France.
France’s 2023 reforms were designed to gradually push the legal retirement age toward 64.
But in 2026, France partially suspended the timetable until 2028.
For pensions taking effect from September 1, 2026, people born between 1964 and 1968 face legal retirement ages ranging roughly from 62 years 9 months to 63 years 9 months, depending on birth year.
The age of 64 now applies from the 1969 generation rather than the 1968 generation. (Service Public)
That makes the infographic’s simple “France 64” understandable as a long-term headline—but inaccurate as a universal current 2026 rule.
It also shows why retirement maps can age very quickly.
Poland Still Has a Five-Year Gender Gap
Poland is one of the countries where retirement ages still differ substantially by sex.
OECD records:
Women: 60
Men: 65. (OECD Data Explorer)
That five-year difference is among the largest remaining gender gaps in OECD pension systems.
Many countries that once had different retirement ages for men and women have gradually equalized them.
Poland has not.
So labeling the country simply “60–65” is much more informative than choosing one figure.
Brazil Also Needs Two Numbers
The infographic lists Brazil as 62.
That only tells part of the story.
Under the general Brazilian age rule, the minimum is normally:
62 for women
and
65 for men. (Serviços e Informações do Brasil)
Brazil’s retirement system also contains contribution requirements and transitional arrangements resulting from previous pension reforms.
So again, the color category may be useful, but the country label should display both sexes.
China Is in the Middle of a Historic Reform
China is one of the most important retirement-age stories in the world.
For decades, its retirement ages were unusually low.
Historically the standard ages were broadly:
60 for men,
55 for many female white-collar workers,
and 50 for many other female employees.
But China began a major reform in January 2025.
Over 15 years, the normal ages will gradually rise:
men from 60 to 63,
white-collar women from 55 to 58,
and many other female workers from 50 to 55. (Social Security Administration)
The infographic’s “60–63” therefore misses the lower female ages.
China should really be shown as a country in transition, with several retirement ages depending on sex and employment category.
And the reason for the reform is powerful:
China is ageing extremely rapidly.
The Social Security Administration notes that China’s old-age dependency ratio is projected to rise sharply by 2050, increasing pressure on the public pension system. (Social Security Administration)
Japan: 65
Japan’s standard public pension age is 65, according to OECD data. (OECD Data Explorer)
That may seem surprisingly low given Japan’s extraordinarily old population.
But pension policy is not the same as actual working behavior.
Many Japanese people continue working beyond the age at which pension benefits become available.
This distinction is crucial:
Statutory pension age does not equal the age everyone actually stops working.
South Korea: 63—for Now
The map’s 63 for South Korea is broadly consistent with current OECD data.
Korea’s normal pension age is gradually increasing and is scheduled eventually to reach 65. OECD records the current normal age as 63. (OECD Data Explorer)
South Korea faces demographic pressures even more severe than Japan’s in some respects, particularly extraordinarily low fertility.
That means further debate about older workers and pension sustainability is almost inevitable.
Singapore Just Changed to 64
This is one of the clearest updates needed on the map.
Singapore’s minimum statutory retirement age increased to:
64 years
on July 1, 2026.
Its re-employment age simultaneously increased to 69. (Ministry of Manpower Singapore)
So the map’s 63 is now outdated.
Singapore is also a good example of why “retirement age” and “pension age” should not be casually mixed.
Its Retirement and Re-employment Act regulates employment relationships, while the country’s CPF retirement system has separate ages governing withdrawals and payouts.
India Cannot Be Reduced to 58–60
The map shows India as 58–60.
That range may resemble some pension and employment rules, but India does not have a single universal retirement age.
For central government employees, the standard superannuation age under Fundamental Rule 56 is generally 60. (Department of Personnel and Training)
But state governments, private employers, pension arrangements and particular occupations can use other ages.
That makes India one of the countries where a gray “varies by system” category would arguably be more accurate.
South Africa Has the Same Problem
South Africa is marked 60.
But 60 is notably the age at which eligible people can qualify for the country’s means-tested old-age grant. (Statistics South Africa)
That does not mean every South African employee has a universal statutory retirement age of 60.
Employment contracts and pension funds can establish different ages, while government employment has its own rules.
So the map is mixing social-pension eligibility with employment retirement rules.
Those are different concepts.
Why Governments Keep Raising Retirement Ages
The basic mathematics is straightforward.
People are living longer.
Fertility has fallen.
The proportion of retirees is increasing in many countries.
And in many places, the number of workers financing each pensioner is shrinking.
If someone retires at 60 and lives to 88, the pension system may support that person for nearly three decades.
When pension ages were originally designed, retirement periods were often much shorter.
That is why governments from Germany and Britain to China and Singapore are gradually pushing retirement ages upward.
OECD projections show the direction clearly: based on current legislation, average normal retirement ages for young workers will rise by roughly two years relative to today’s retirees. (OECD)
Some countries are going even further.
OECD says future normal retirement ages are projected to reach 70 or more in Denmark, Estonia, Italy, the Netherlands and Sweden under currently legislated mechanisms. (OECD)
That does not mean everybody there is retiring at 70 today.
It means younger generations could face dramatically later pension eligibility.
Retirement Age Is Also a Political Choice
Demography explains why retirement ages are rising.
It does not determine the exact number.
Two equally wealthy countries with similar life expectancy can choose different systems.
One may raise the retirement age.
Another may increase contributions.
Another may reduce future benefits.
Another may rely more heavily on private pensions.
Another may encourage people to work longer voluntarily.
And voters often react strongly because retirement policy affects something deeply personal:
how many healthy years people expect to have after decades of work.
That is why relatively small changes—from 62 to 64, for example—can trigger enormous political controversy.
The Map of Retirement Is Really a Map of Ageing
Viewed globally, the infographic reveals a broader divide.
Many wealthier countries with older populations cluster around 65–67.
Some younger developing countries use ages closer to 58–62.
But that divide is slowly narrowing as emerging economies age too.
China is already increasing its retirement age.
Other countries will likely face similar decisions in coming decades.
The world is entering an era in which living longer is simultaneously a major human achievement and one of the biggest challenges facing pension systems.
Final Thought
There is no universal age when a human being becomes “too old to work.”
Retirement ages are rules created by governments, pension systems and employers.
They reflect:
life expectancy,
health,
labor markets,
government budgets,
historical policy,
politics,
and ideas about what society owes people after a lifetime of work.
Today, 65 remains one of the world’s most common reference ages.
But 67 is becoming increasingly normal in wealthier ageing societies.
And for younger generations, even 67 may not be the final number.
The real story behind the map is therefore not simply:
“What age do people retire?”
It is:
“How long can modern societies afford to support retirement as people live longer and populations grow older?”
That question will shape pension policy for decades.
Recommended Infographic Wording
I would change the subtitle from:
“Typical statutory retirement age for a full-career worker”
to:
“Typical public pension eligibility / normal retirement age — simplified. Ages may vary by sex, birth year, career length and pension system.”
That avoids mixing the OECD definition of a normal retirement age after a full career with statutory pension ages and employment retirement ages.
I would also update Singapore to 64, Germany to 66–67, the UK to 66–67, France to a cohort-dependent range, Brazil to 62 women / 65 men, and show China more explicitly as a multi-stage transition. (Ministry of Manpower Singapore)