
Look closely at a livestock map of Europe and one animal seems to be almost impossible to escape:
the chicken.
From Britain and France to Germany, Poland, Scandinavia and large parts of eastern Europe, chickens appear across an enormous portion of the continent.
But the pattern changes dramatically in certain regions.
Pigs become especially important across parts of northwestern and central Europe.
Cattle dominate many Alpine and grassland areas.
Sheep and goats become much more visible across the Mediterranean, Iberia and mountainous southeastern Europe.
The resulting map is more than a picture of farm animals.
It is a map of climate, terrain, food traditions, agricultural economics and centuries of adaptation to the European landscape.
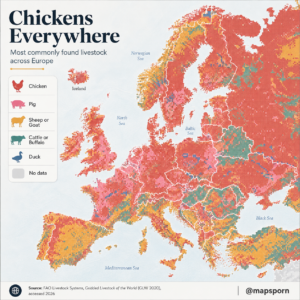
What Exactly Does This Map Show?
The source is FAO’s Gridded Livestock of the World, usually shortened to GLW.
GLW is a peer-reviewed spatial dataset designed to estimate where livestock are located and how densely animals are distributed around the world. FAO says the data are used for subjects ranging from food security and rural livelihoods to animal health and environmental research. (FAO Data)
The latest GLW4 dataset uses a 2020 reference year and incorporates harmonized subnational livestock statistics together with spatial modeling.
Its 10-km layers express density in approximately:
animals per square kilometer
or, for poultry,
birds per square kilometer. (FAO Data)
So if a grid cell appears as chicken-dominant, that does not necessarily mean chickens are the most economically valuable animals there.
It means chickens are estimated to outnumber the other livestock categories being compared in that location.
That distinction matters enormously.
Why Chickens Cover So Much of Europe
FAO describes chickens as the most ubiquitous and abundant domestic livestock species, occurring more or less everywhere humans live. (FAOHome)
There are several reasons.
Chickens Require Relatively Little Space
A dairy cow requires substantial:
land,
feed,
water
and infrastructure.
A chicken requires dramatically less physical space.
That makes poultry suitable for both:
large industrial farms
and
tiny household operations.
Historically, even families without enough land for cattle could keep chickens beside a house or barn.
Chickens Reproduce Quickly
Cattle take years to reach maturity.
Chickens have much shorter production cycles.
Modern broiler chickens can be raised for meat in a matter of weeks, while laying hens produce large numbers of eggs.
FAO notes that poultry production can expand quickly because of these short life cycles and relatively efficient feed conversion. (FAOHome)
This makes chicken production highly responsive to food demand.
Chickens Provide Two Major Foods
Chickens supply both:
meat
and
eggs.
Small-scale flocks can provide both products simultaneously.
Industrial agriculture usually separates them into specialized:
broiler operations for meat
and
layer operations for eggs.
Few other livestock species can produce two globally important food categories with such efficiency.
But There Is a Statistical Reason Chickens Dominate Too
Suppose one farm contains:
200 cattle
and
50,000 chickens.
If the map simply asks which livestock species has the largest number of individual animals, chickens win overwhelmingly.
But one chicken obviously does not represent the same body mass, land requirement or economic value as one cow.
This means the map should be understood as a comparison of animal numbers, not livestock biomass.
If Europe were mapped by:
total live weight,
feed consumption,
land use
or economic value,
the pattern could look very different.
Cattle would suddenly become much more visually important.
That does not make the chicken map wrong.
It simply means the question being asked matters.
The Pig Belt of Northwestern and Central Europe
The pink patches across parts of Europe reveal another important agricultural region.
Pig farming has deep roots in:
Germany,
the Netherlands,
Belgium,
Denmark,
France,
Spain
and several Central European countries.
Pigs became particularly suitable for intensive farming because they can convert concentrated feed into meat efficiently and do not require large grazing areas.
Modern pig production is therefore often concentrated near:
grain production,
feed industries,
transport infrastructure
and meat-processing facilities.
That is why pig geography does not always resemble a natural grassland map.
Unlike cattle or sheep, pigs do not need enormous open pastures.
They can be raised intensively.
Denmark Is a Famous Example
Denmark has long maintained an internationally important pork industry despite its relatively small population.
Pig farming became closely integrated with:
grain farming,
cooperatives,
slaughterhouses
and export markets.
Similar agricultural systems developed in parts of Germany and the Netherlands.
So where the map shows pink concentrations, we may be seeing not simply natural geography but highly organized modern agricultural economies.
Spain Has Both Pigs and Sheep
Spain is especially interesting.
Large sections of the Iberian Peninsula appear associated with sheep or goats, but pig farming is also extremely significant.
Spain has one of Europe’s largest pig industries.
At the same time, extensive sheep farming remains important in drier interior landscapes.
And the country’s famous Iberian pig tradition is tied to the dehesa landscapes of western and southwestern Spain, where pigs can forage beneath oak trees.
This demonstrates a recurring theme:
National borders rarely correspond to a single farming system.
Spain contains several different agricultural Europes inside one country.
Cattle Follow Grass, Water and Mountain Valleys
The green areas associated with cattle or buffalo reveal a different relationship with geography.
Cattle farming often thrives where there is:
reliable rainfall,
productive grass,
moderate temperatures,
and sufficient land.
That helps explain concentrations across:
the Alps,
parts of France,
Central European uplands,
the Balkans
and other grazing regions.
The Alps Are Classic Cattle Country
Switzerland and nearby Alpine regions are closely associated with dairy cattle for good reason.
Mountain slopes that are difficult to plow can still produce grass.
Humans cannot eat grass directly.
Cattle can.
They transform that grass into:
milk,
cheese,
butter
and meat.
This allowed farming communities to extract food from landscapes that would otherwise be difficult to cultivate intensively.
Famous Alpine cheeses—from Swiss varieties to regional cheeses in France, Italy and Austria—are therefore products of geography as much as cuisine.
Mountains Can Favor Grazing Over Crops
Steep terrain creates obvious problems for agriculture.
You cannot easily run large harvesting machinery across a rocky mountain slope.
But grazing animals can move through terrain where crops are impractical.
That is why livestock becomes especially important in many mountainous areas.
The animal that dominates depends on the landscape.
Moist productive mountain meadows may support cattle.
Hotter, drier and rockier terrain often favors sheep and goats.
Sheep and Goats Become More Visible in the Mediterranean
The orange areas are especially prominent across:
Spain,
parts of Italy,
Greece,
the Balkans,
Türkiye
and other Mediterranean regions.
This pattern makes ecological sense.
Sheep and goats are well adapted to environments where cattle can struggle.
They can use:
dry grasslands,
scrubby vegetation,
steep slopes,
rocky terrain
and relatively marginal agricultural land.
Goats in particular can browse vegetation that many other farm animals ignore.
That makes them extremely useful in landscapes where lush pasture is unavailable.
Why the Mediterranean Developed a Sheep-and-Goat Tradition
Mediterranean summers are often hot and dry.
Rainfall is strongly seasonal.
Large areas have:
thin soils,
mountains,
scrubland
and drought-prone vegetation.
Those conditions helped make sheep and goats central to local farming for thousands of years.
They supplied:
milk,
cheese,
meat,
wool,
skins
and manure.
Think about the famous cheeses of southern Europe.
Feta traditionally relies heavily on sheep’s and goat’s milk.
Pecorino literally derives its name from the Italian word for sheep.
Numerous Balkan and Mediterranean cheeses follow similar pastoral traditions.
The cuisine reflects the animals that the landscape could support.
Why Britain Shows a Mixture
The British Isles contain a fascinating mixture.
Lowland areas can support:
cattle,
pigs,
poultry
and intensive agriculture.
Move into upland Wales, northern England or Scotland and sheep become much more prominent.
Again, topography changes the farming system.
Sheep can graze hills where intensive cropping would be inefficient.
This is why sheep became so strongly associated with:
Wales,
the Scottish Highlands,
the Pennines
and other upland British landscapes.
Meanwhile, poultry and pigs can be concentrated in completely different lowland agricultural regions.
Ireland’s Grass Changes Everything
Ireland is famous for its green landscape.
That grass is agriculturally valuable.
The country’s mild, wet Atlantic climate creates conditions that support grazing over long periods of the year.
This gives cattle—particularly dairy and beef production—a major role in Irish agriculture.
Ireland demonstrates one of the simplest relationships on the entire livestock map:
rain → grass → cattle.
Of course, the real agricultural system is more complicated.
But the geographic foundation is obvious.
Eastern Europe Shows Large Mixed Zones
Across Poland, Ukraine, Belarus, Romania and neighboring regions, the map becomes a mosaic.
That reflects the diversity of agricultural landscapes.
Some regions have productive cropland and intensive poultry.
Others have strong pig sectors.
Grasslands support cattle.
Carpathian and Balkan uplands support grazing animals.
Modern industrial agriculture sits beside older small-scale farming systems.
The result is not one continuous “Eastern European livestock culture.”
It is a patchwork shaped by:
soil,
rainfall,
population density,
farm structure,
markets
and history.
Why Livestock Concentrates Near People
One striking feature of FAO’s livestock maps is that animals are not distributed randomly across suitable climates.
Human geography matters too.
Livestock tends to concentrate where farmers can access:
feed,
roads,
processors,
veterinary services,
labor
and consumers.
This is especially true for intensive chicken and pig farming.
A giant poultry facility does not need to sit in the landscape where chickens originally evolved.
It needs:
affordable feed,
reliable electricity,
transportation,
processing facilities
and market access.
That is why modern livestock maps partly resemble economic maps.
Industrial Farming Has Changed an Ancient Map
If we could produce the same livestock map for Europe 500 years ago, it would probably look very different.
Traditional livestock numbers were constrained by local land and feed.
Today feed can be transported internationally.
Soybeans from South America can feed European pigs or poultry.
Grain can move hundreds of kilometers.
Temperature-controlled buildings can house animals regardless of local weather.
Refrigerated trucks move meat across the continent.
This has weakened the relationship between livestock and immediate local ecology.
Yet the older pattern remains visible—especially for grazing animals.
Chickens Are the Ultimate Modern Livestock Animal
No animal illustrates this agricultural transformation better than the chicken.
FAO calls chickens the fastest-growing livestock subsector and notes their short production cycles and strong feed-conversion potential. (FAOHome)
Chickens can be raised almost anywhere with sufficient:
feed,
water,
temperature control
and infrastructure.
They therefore escape many of the geographical limitations that historically controlled livestock.
Sheep still care whether the landscape has grazing.
Cattle still require huge amounts of feed.
Modern chickens can be housed in purpose-built facilities across a much wider range of environments.
That helps explain the enormous red presence on the European map.
Why This Map Is Useful Beyond Farming
FAO did not create GLW simply to produce interesting livestock maps.
Knowing where livestock are concentrated matters for many serious questions.
Food security
Livestock provides meat, dairy and eggs to billions of people.
Animal disease
Knowing animal density can help model how livestock diseases may spread.
Zoonotic disease
Some pathogens can move between animals and humans.
Environmental impact
Different livestock systems have different effects on:
land,
water,
nutrient pollution
and greenhouse-gas emissions.
Rural livelihoods
Livestock remains economically important to millions of households.
FAO explicitly lists food security, livelihoods, health and environmental analysis among GLW’s intended applications. (FAO Data)
One Grid Cell Does Not Mean Every Farm Is the Same
This is another important limitation.
GLW is a model.
The 2020 10-km version estimates animal density at approximately 10-km spatial resolution using harmonized livestock statistics and spatial predictors. (FAO Data)
So when a grid cell is colored red, that does not mean:
“Every farm inside this square raises chickens.”
It means the modeled chicken population is dominant under whatever comparison rule was used.
Within the same cell there might also be:
cattle,
pigs,
sheep
and goats.
The map deliberately reduces that complexity to one dominant category so readers can see the broad geographical pattern.
The Biggest Pattern: Chickens Are Everywhere, Grazers Follow Geography
Viewed from a distance, Europe reveals two overlapping agricultural systems.
The first is modern intensive livestock production.
It includes especially:
chickens and pigs.
These animals can be concentrated close to feed supplies and infrastructure.
The second is land-based grazing.
It includes:
cattle, sheep and goats.
Their distributions still respond much more visibly to:
grass,
rainfall,
mountains,
drylands
and pasture.
That is why chickens can cover huge sections of the map while sheep, goats and cattle trace some of Europe’s physical landscapes.
What the Map Really Tells Us
At first glance, the message seems simple:
Europe has a lot of chickens.
But look deeper and the map becomes a lesson in how humans convert landscapes into food.
Green Alpine cattle zones reveal mountain pasture.
Orange Mediterranean areas reveal dry-land pastoralism.
Pig regions reveal intensive agricultural economies.
Chicken regions reveal the extraordinary flexibility of modern poultry farming.
Every color is therefore connected to both:
natural geography
and
human technology.
Europe’s livestock map is ultimately a map of how people adapted animals to different environments—and then used modern agriculture to overcome many of those environmental limits.
Accuracy Note for Your Infographic
The FAO Gridded Livestock of the World source is strong. GLW is a peer-reviewed livestock-distribution dataset, and the latest GLW4 product uses a 2020 reference year. The 10-km dataset models density for cattle, buffaloes, sheep, goats, pigs and chickens. (FAO Data)
However, I would change three things before publishing:
1. Remove “Duck” if this is strictly GLW4-2020.
FAO’s current 2020 GLW4 release contains buffalo, cattle, sheep, goats, pigs and chicken, not ducks. Ducks are included in earlier GLW releases such as the 2015 dataset. (FAO Data)
2. Clarify what “most common” means.
Use something like:
“Livestock species with the highest modeled animal density in each grid cell.”
Otherwise readers may interpret it as the most common farm type or the most economically important species.
3. Mention that chickens are compared by individual head count.
A chicken and a cow each count as one animal, despite enormous differences in size. If the map used biomass or economic value instead of animal numbers, the result would look different.
A stronger subtitle would be:
“Dominant modeled livestock species by animal density, based on FAO GLW4 reference-year 2020 data.”