
Europe contains many of the tallest female populations in the world.
But the differences within the continent are surprisingly large.
According to NCD-RisC’s internationally comparable estimates for 19-year-olds in 2019, females in the Netherlands averaged approximately:
170.4 cm
At the other end of the European range, Cyprus averaged approximately:
160.6 cm.
That is a difference of almost 10 centimeters between the two populations.
And the geography is not random.
The tallest averages cluster strongly around:
the Netherlands,
parts of Scandinavia,
the Baltic region,
Central Europe,
and several countries of the western Balkans.
Southern European countries generally appear shorter.
Understanding why takes us beyond genetics and into childhood nutrition, disease, living standards and the history of human growth.
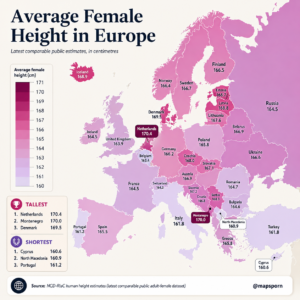
First: What Exactly Does This Map Measure?
This is the most important point.
The map does not mean that the average Dutch woman of every age is exactly 170.4 cm tall.
The source comes from NCD-RisC’s global study of growth trajectories.
For its 2019 comparison, researchers estimated the average height of 19-year-old males and females in 200 countries and territories. (NCDRISC)
So the figures represent young people who had essentially completed most of their linear growth.
That makes them particularly useful for international comparisons.
Using all adult ages would create another problem: people tend to lose height as they get older.
A country with an older population could therefore appear artificially shorter than a younger country even if the two populations had similar heights when they reached adulthood.
Using the same age makes the comparison much cleaner.
Netherlands: Europe’s Tallest Women
The Netherlands sits at the top of the ranking.
Average height among 19-year-old Dutch females in 2019 was estimated at:
170.4 cm.
NCD-RisC found Dutch females to be the tallest of any country included in the global analysis. (DOI)
Dutch males were also ranked first globally, averaging approximately 183.8 cm at age 19.
So the Netherlands’ reputation as a very tall country is supported by large-scale international data.
But why?
There is no single explanation.
Genetics clearly matters.
Height is a highly polygenic trait, meaning thousands of genetic variants contribute small effects to how tall an individual ultimately becomes. Modern genetic research describes human height as one of the classic examples of a complex polygenic trait. (Nature)
But genetic potential alone does not determine final height.
Nutrition and childhood environment also matter enormously.
Montenegro: Almost as Tall as the Netherlands
The second-highest value on the map belongs to Montenegro:
170.0 cm.
That may surprise readers who assume the tallest European populations would all be concentrated in Scandinavia.
Instead, the western Balkans contain one of Europe’s most remarkable tall-population clusters.
Montenegro sits beside other relatively tall countries including:
Serbia — about 168.3 cm
Croatia — about 166.8 cm
Slovenia — about 167.2 cm
and nearby Central European populations.
NCD-RisC ranked Montenegro second globally among 19-year-old females in 2019. (DOI)
The region’s unusual height has long interested researchers studying the interaction between population genetics and nutrition.
It demonstrates that Europe’s height geography cannot be explained simply by latitude.
Denmark: 169.5 cm
Denmark ranks third on the map at:
169.5 cm.
It was also third globally among females in the 2019 NCD-RisC results, behind only the Netherlands and Montenegro. (EurekAlert!)
Denmark joins the Netherlands in a broader northern European tall-height cluster.
Other Nordic values shown include:
Iceland — 168.9 cm
Sweden — 166.7 cm
Finland — 166.5 cm
Norway — 166.4 cm
So the Nordic countries are generally tall, but they are not identical.
Denmark and Iceland stand noticeably above Norway and Finland in this dataset.
The Baltic States Are Surprisingly Tall
Another striking region appears around the Baltic Sea.
The map shows:
Estonia — 168.7 cm
Latvia — 168.8 cm
Lithuania — 167.6 cm
These are among the highest figures in Europe.
Latvia and Estonia especially sit close to Iceland and Denmark.
The official NCD-RisC results placed Latvia and Estonia among the world’s tallest female populations. (EurekAlert!)
This is one of the map’s most interesting features because these countries are sometimes overlooked in discussions about European height.
The Baltic region clearly belongs to Europe’s tall-population zone.
Czechia and Slovakia Are Tall Too
Central Europe contains another cluster.
Czechia:
168.0 cm
Slovakia:
167.1 cm
Austria:
166.9 cm
Germany:
166.2 cm
Poland:
165.8 cm
The Czech Republic was among the world’s ten tallest female populations in the NCD-RisC comparison. (EurekAlert!)
Again, geographical neighbors differ by several centimeters.
That tells us there is no simple “Central European height.”
Population histories and environmental conditions differ even over relatively short distances.
Britain, Ireland and France Sit Closer to the Middle
Western Europe looks quite different.
The infographic gives:
United Kingdom — 163.9 cm
Ireland — 164.5 cm
France — 164.5 cm
Belgium — 163.4 cm
Switzerland — 164.3 cm
These are not short populations globally.
Europe as a whole contains many relatively tall populations.
But compared with Dutch, Danish, Montenegrin or Baltic females, the difference becomes noticeable.
A Dutch 19-year-old female average of 170.4 cm is more than six centimeters above the corresponding British estimate shown here.
That is large enough to be visible when comparing groups.
Southern Europe Is Generally Shorter
The map’s lighter shades become more common as we move toward southern Europe.
Examples include:
Portugal — 161.2 cm
Italy — 161.8 cm
Türkiye — 161.8 cm
North Macedonia — 160.9 cm
Cyprus — 160.6 cm
Spain, however, sits somewhat higher at:
165.5 cm
while Greece is around:
165.8 cm.
So even the southern pattern has important exceptions.
The Mediterranean region should not be treated as one homogeneous population.
Cyprus Has the Lowest European Estimate
Among the countries displayed, Cyprus is lowest at:
160.6 cm.
North Macedonia follows closely at 160.9 cm, while Portugal is around 161.2 cm.
These figures match the NCD-RisC-based European ranking commonly derived from the 2019 dataset. (Landgeist)
But “shortest in Europe” should not be interpreted negatively.
Height is not a ranking of health, attractiveness or physical capability.
It is simply a population characteristic.
A difference of several centimeters between national averages says very little about any particular individual.
There are tall Cypriot women and short Dutch women.
Population averages overlap enormously.
Why Are People Taller in Some Countries?
There is no single “tall gene.”
Human height results from a combination of:
genetics
and
environmental conditions during growth.
Modern research estimates that genetics accounts for a large proportion of individual height variation in well-nourished populations, while environmental factors determine how fully a person’s genetic growth potential is realized. (PubMed)
The environmental side is particularly interesting for geography.
Childhood Nutrition Matters
Growth requires energy and nutrients.
Poor nutrition during pregnancy, infancy, childhood or adolescence can limit linear growth.
A major review of adult height identifies nutrition as one of the most important external influences on final stature. (PubMed Central (PMC))
Protein quality, total energy availability and micronutrients can all matter.
But it would be an oversimplification to say something like:
“Dutch women are tall because they drink milk.”
National height differences cannot be reduced to one food.
The entire nutritional environment matters.
Childhood Disease Matters Too
Growing bodies must divide limited resources between:
growth,
immune response
and basic survival.
Repeated infections during childhood can interfere with growth, especially when combined with poor nutrition.
Research comparing historical European birth cohorts found strong relationships between childhood disease environments and final adult height. Declines in childhood mortality and disease burden accompanied substantial increases in adult stature over the twentieth century. (PubMed Central (PMC))
This is why historians sometimes use average height as an indirect measure of past living standards.
When nutrition, sanitation and childhood health improve, populations often become taller over subsequent generations.
Height Can Change Much Faster Than Genetics
This is critical.
Human genetic populations do not dramatically transform in only a few generations.
Yet national average heights have.
NCD-RisC has documented large changes in childhood and adolescent height across countries over recent decades. (NCDRISC)
That demonstrates how strongly environment can influence the expression of genetic potential.
Better:
prenatal care,
childhood nutrition,
sanitation,
vaccination,
healthcare,
housing
and living standards
can all contribute to healthier physical growth.
So a height map partly represents genetics—but it also carries an imprint of socioeconomic history.
Why Northern Europe Isn’t Uniformly Tall
If latitude or cold climate determined height, Scandinavia would all look the same.
It doesn’t.
Denmark: 169.5 cm.
Sweden: 166.7 cm.
Norway: 166.4 cm.
Finland: 166.5 cm.
Those differences demonstrate why simplistic environmental explanations fail.
Countries contain different ancestry patterns, nutritional traditions and historical experiences.
Height is produced by many small influences acting together.
The Balkan Pattern Is Especially Fascinating
Montenegro at 170.0 cm is perhaps the best evidence that the “tall northern European” stereotype is incomplete.
Several populations around the Dinaric Alps are unusually tall.
Researchers studying European height have found that both nutritional variables and population-genetic factors appear relevant to European stature differences, although determining exactly how much each contributes is difficult. (PubMed)
This is a good example of geography revealing something that political maps often hide.
Different regions can share biological and historical patterns across modern national borders.
Women and Men Show Similar Geography
One interesting feature of European height is that the countries with very tall women frequently also have very tall men.
The Netherlands ranked first among both sexes in the NCD-RisC 2019 results.
Montenegro was second for both.
Denmark was among the top female populations, while several Balkan and Baltic countries also ranked extremely high among males. (DOI)
That reinforces the idea that we are seeing broader population-level influences rather than something unique to one sex.
Average Height Is Not a Fixed National Trait
It is tempting to think:
“Dutch people are 170.4 cm.”
But that is not what the statistic means.
170.4 cm was an estimated mean for Dutch females aged 19 in 2019.
People born several decades earlier can have a different average.
Future generations may have another.
Migration can change population averages.
Nutrition can change.
Childhood health changes.
Economic conditions change.
Height maps are therefore snapshots of particular birth cohorts—not permanent biological labels attached to nationalities.
Why These Numbers Have Uncertainty
NCD-RisC does not measure every 19-year-old in Europe.
It combines many population studies and uses statistical models to produce nationally comparable estimates.
For the Netherlands, for example, the estimated 2019 female height was 170.4 cm, but the study reported a credible interval, reflecting uncertainty around the estimate. (DOI)
The study itself pooled:
2,181 population-based studies
with anthropometric measurements from approximately:
65 million participants.
Those data covered 200 countries and territories. (DOI)
That makes it one of the most comprehensive international height analyses available.
But estimates should still not be treated as measurements accurate to the last millimeter.
The difference between 166.7 and 166.8 cm is not meaningful enough to support claims that one country’s women are definitively “taller” than another’s in everyday terms.
The Big European Pattern
Once the individual numbers are put aside, a remarkably clear geography emerges.
Very tall cluster
Netherlands, Montenegro, Denmark, Iceland and parts of the Baltic region.
Tall cluster
Czechia, Serbia, Lithuania, Slovenia, Slovakia, Austria and several neighboring populations.
Middle range
Germany, Poland, Ukraine, Sweden, Finland, Norway, Spain and Greece.
Lower European range
Portugal, Italy, Türkiye, North Macedonia and Cyprus.
These are broad patterns—not biological boundaries.
People have moved across Europe continuously for thousands of years.
National borders are far newer than human populations.
What This Map Really Tells Us
At first glance this is just a map of centimeters.
But average height contains information about much more than stature.
It reflects the interaction of:
genetic inheritance,
prenatal conditions,
childhood nutrition,
infectious disease,
healthcare,
economic development
and living conditions.
That is why anthropologists, epidemiologists and economic historians have studied height for decades.
A population’s height can provide clues about the environment in which children grew up.
And Europe’s map demonstrates just how differently those influences have operated across populations.
Final Thought
The tallest female population in the NCD-RisC 2019 comparison was the Netherlands at around 170.4 cm.
Montenegro followed at 170.0 cm.
Denmark reached 169.5 cm.
At the other end of Europe, Cyprus was around 160.6 cm, North Macedonia about 160.9 cm, and Portugal approximately 161.2 cm. (EurekAlert!)
That nearly 10-centimeter European range did not arise from one cause.
It reflects generations of interaction between biology and environment.
And that is what makes height maps more interesting than they first appear.
They are not merely maps of how tall people are.
They are maps of human growth, history and childhood conditions.
Accuracy Note for Your Infographic
The individual figures are broadly consistent with the NCD-RisC dataset, particularly the highest and lowest values. The main problem is how the data are described.
I would change:
“Average Female Height in Europe”
to:
“Average Height of 19-Year-Old Females in Europe”
And change:
“Latest comparable public estimates”
to:
“NCD-RisC modeled estimates for 2019, in centimeters.”
NCD-RisC’s current height data page still points to the 2020 Lancet study as the source for these national height estimates, and its visualization explicitly states that the figures refer to children aged 5 or adolescents aged 19. (NCDRISC)
I would also add a small note:
“Figures represent population averages with statistical uncertainty and should not be interpreted as the height of all adult women.”
That would make the infographic much more defensible.