
Alcohol is one of the world’s oldest and most widespread psychoactive substances.
Wine has been produced for thousands of years.
Beer appears in some of humanity’s earliest written records.
Distilled spirits became embedded in cultures from Europe to East Asia and the Americas.
Yet here is a fact that can be easy to overlook:
A huge share of humanity does not drink alcohol at all.
And in some countries, the overwhelming majority of adults report that they have never consumed alcohol in their lifetime.
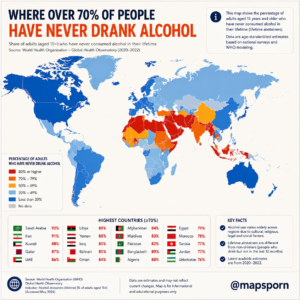
The map above shows the global geography of what the World Health Organization calls lifetime alcohol abstinence.
The strongest concentrations stretch across North Africa, the Middle East and parts of South and Central Asia.
Meanwhile, lifetime abstinence is much less common across most of Europe, North America, Australia and parts of East Asia.
The pattern is one of the clearest cultural divides visible on a global behavioral map.
But religion is only part of the explanation.
Law, family norms, gender, income, availability, government policy, history and even the way surveys are answered can all influence the numbers.
What Does “Lifetime Abstainer” Actually Mean?
WHO gives the term a very specific definition.
A lifetime abstainer is a person aged 15 or older who reports having never consumed alcohol during their lifetime. The estimate is generally derived from representative population surveys and weighted to represent the population. (World Health Organization)
That is very different from somebody who simply does not drink today.
WHO separates people into several categories.
Lifetime abstainers: have never consumed alcohol.
Former drinkers: consumed alcohol previously but not during the past 12 months.
Past-12-month abstainers: everyone who did not drink during the previous year, which includes both lifetime abstainers and former drinkers. (World Health Organization)
That distinction can dramatically change a country’s percentage.
Someone who drank a glass of wine once 20 years ago can no longer technically be counted as a lifetime abstainer—even if they have avoided alcohol ever since.
Most Adults Worldwide Were Not Drinking in 2019
The global picture may surprise people.
WHO’s 2024 global alcohol report estimates that 56% of the world’s population aged 15 and older had abstained from alcohol during the previous 12 months in 2019.
Women abstained more often than men: about 65% of women versus 48% of men. (Iris)
That does not mean 56% had never drunk alcohol.
The figure includes former drinkers.
But it demonstrates an important point:
Drinking alcohol is not universal human behavior.
WHO specifically notes that prevalence of drinking varies enormously between regions, with the lowest levels concentrated in a belt of largely Muslim-majority countries stretching from North Africa through the Middle East and Pakistan toward Indonesia. (Iris)
The Middle East Has Some of the World’s Highest Abstinence Levels
The most obvious feature of the map is the deep red region stretching across the Arabian Peninsula and neighboring countries.
Countries shown with exceptionally high lifetime-abstinence estimates include places such as:
- Saudi Arabia
- Iran
- Kuwait
- Qatar
- United Arab Emirates
- Yemen
- Iraq
- Bahrain
- Oman
The exact percentage varies depending on the survey year and WHO estimate being used, so country rankings should be checked before publication.
But the broad regional pattern is extremely well established.
WHO’s latest global report says alcohol use is lowest across a group of Muslim-majority countries running from North Africa through the Middle East and farther east into Asia. (Iris)
Why Is Alcohol Abstinence So High There?
The largest cultural factor is religion.
Islam prohibits intoxicating alcohol, and that teaching has profoundly influenced social norms throughout much of the Muslim world.
But the effect varies by country.
In some places, alcohol is legally prohibited or tightly restricted.
Elsewhere it can be purchased under certain conditions.
Some countries permit sales mainly to foreigners or in licensed hotels and restaurants.
Others allow alcohol more broadly but maintain strong cultural discouragement.
So the map is not simply measuring religious belief.
It reflects the combination of:
religion + law + social norms + availability.
WHO itself says cultural—and especially religious—factors are major reasons for the enormous international differences in drinking prevalence. (Iris)
Saudi Arabia
Saudi Arabia represents perhaps the clearest example of a society where alcohol prohibition has historically been reinforced by both religion and law.
Alcohol consumption has traditionally been prohibited under the country’s legal system.
That creates an environment where abstinence is not merely a personal lifestyle decision.
It is strongly reinforced socially and institutionally.
This helps explain why Saudi Arabia consistently appears among countries with very low levels of recorded alcohol consumption and very high reported abstinence.
However, even countries with strict restrictions can have some unrecorded consumption, which is one reason health organizations use several different indicators rather than relying exclusively on official sales statistics.
Iran
Iran shows a similar broad pattern.
Alcohol is prohibited for the Muslim population under Iranian law, although exceptions exist for recognized non-Muslim religious minorities in limited religious contexts.
Social and religious norms therefore heavily discourage drinking.
As a result, reported lifetime abstinence is very high.
But this also highlights an important statistical issue.
Whenever behavior is illegal or strongly stigmatized, respondents may be less willing to report it honestly.
So high abstinence figures in prohibition environments should be interpreted as survey estimates, not perfectly observable facts.
The Gulf States Are More Complicated Than the Map Suggests
Countries such as Qatar and the United Arab Emirates deserve special caution.
They contain unusually large expatriate populations drawn from many different cultures.
Their resident populations can therefore include:
- Muslim citizens
- Muslim expatriates
- Western expatriates
- South Asian communities
- Southeast Asian workers
- other international populations
Some Gulf countries also permit regulated alcohol sales in particular licensed establishments.
That means lifetime-abstinence estimates can change substantially depending on population structure, survey methodology and year.
For example, an older WHO Qatar country profile estimated 44.9% lifetime abstinence among adults in 2016, considerably different from the much higher number printed for Qatar in this infographic. (World Health Organization)
That does not necessarily mean either dataset is fraudulent; it means the exact year and methodology matter enormously.
For this reason, I would verify each percentage before putting a “top countries” ranking on the final graphic.
North Africa Forms Another Major Abstinence Belt
The red and orange colors continue westward across North Africa.
Countries such as:
- Egypt
- Libya
- Algeria
- Morocco
- Tunisia
typically report much higher abstinence than most European nations immediately across the Mediterranean.
That produces an extraordinary geographic contrast.
Travel only a relatively short distance from Spain to Morocco or from Italy toward North Africa and the social role of alcohol changes dramatically.
Again, Islam plays an important role, but national practice differs.
Tourism has made alcohol commercially available in parts of Morocco, Tunisia and Egypt.
Yet availability in resorts does not necessarily mean widespread consumption among local populations.
That is why looking only at bars, restaurants or tourist districts can produce a very misleading picture of national drinking behavior.
Pakistan and Bangladesh
The high-abstinence belt continues into South Asia.
Pakistan has a predominantly Muslim population and significant restrictions surrounding alcohol.
Bangladesh also has strong religious and regulatory constraints.
A WHO-associated population study in Bangladesh found that 94.4% of surveyed adults reported being lifetime abstainers, although that study represented a particular survey population and period rather than the exact map estimate. (Iris)
The gender difference was especially striking.
Only a very small share of women reported ever consuming alcohol.
That illustrates another important feature hidden by a single national percentage:
Men and women can have dramatically different drinking patterns within the same country.
Why Gender Matters
Globally, men are considerably more likely than women to drink alcohol.
WHO reported that in 2019:
52% of men were current drinkers
compared with
35% of women. (World Health Organization)
The difference can become considerably larger in societies where drinking by women carries stronger social stigma.
So a national lifetime-abstinence rate may conceal two very different realities.
Men might drink relatively frequently while the overwhelming majority of women abstain.
Age can also matter.
Younger generations may follow different norms from their parents and grandparents.
This is why WHO’s underlying indicator can be disaggregated by age and sex. (World Health Organization)
India Is More Complicated Than One Color
India provides another good example of how national maps oversimplify reality.
India contains:
- More than a billion people
- Numerous religions
- Different state alcohol laws
- Enormous differences between urban and rural areas
- Major regional cultural differences
Some Indian states have implemented prohibition.
Others permit widespread alcohol sales.
Drinking prevalence also varies strongly by gender and region.
So although India may show relatively high national abstinence compared with Europe, it would be wrong to describe India as having one uniform alcohol culture.
National averages are useful.
They are not complete portraits of societies.
Southeast Asia Shows a Cultural Transition Zone
The map becomes especially interesting around Southeast Asia.
Indonesia, with the world’s largest Muslim population, generally shows high abstention.
But nearby countries can look dramatically different.
Vietnam, Thailand, Cambodia and Laos have their own deeply established drinking traditions.
The Philippines has another historical and cultural pattern.
Malaysia combines a Muslim-majority population with substantial Chinese and Indian minorities.
In other words, the region demonstrates how quickly drinking behavior can change across borders even when climates and economic conditions are relatively similar.
Culture matters.
Europe Is on the Opposite End of the Spectrum
Most of Europe appears dark blue on the map, indicating relatively low lifetime abstinence.
WHO’s latest report describes the European Region as having the highest alcohol consumption per person in the world and the lowest overall prevalence of abstention. (World Health Organization)
According to WHO’s globally comparable 2019 data, roughly two out of every three adults in the European Region were current drinkers. (World Health Organization)
Alcohol is historically woven into many European cultures.
Wine plays a major role in Mediterranean societies.
Beer has long traditions across Central and Northern Europe.
Spirits are culturally important in parts of Eastern and Northern Europe.
But the differences within Europe are also considerable.
A wine-producing Mediterranean society and a northern beer culture can both have relatively few lifetime abstainers while having very different patterns of drinking.
Low Abstinence Does Not Necessarily Mean Heavy Drinking
This is another crucial distinction.
Imagine two countries.
In Country A, 80% of adults drink alcohol occasionally but most have only a few drinks each year.
In Country B, only 30% of adults drink—but those drinkers consume very large quantities.
Which country has the more serious alcohol problem?
A lifetime-abstinence map cannot answer that.
WHO therefore tracks several different measures, including:
- Current drinkers
- Lifetime abstainers
- Former drinkers
- Alcohol consumption per capita
- Consumption among drinkers
- Heavy episodic drinking
- Alcohol-use disorders
WHO explicitly explains that abstinence data are needed alongside per-capita consumption because population averages alone do not show who is actually drinking or how. (World Health Organization)
So this map should not be interpreted as a ranking of countries from “healthy” to “unhealthy.”
It measures one behavior only.
North America Has Relatively Few Lifetime Abstainers
The United States and Canada appear dark blue.
Alcohol is legal, widely available and culturally normalized for adults in both countries.
Drinking is common at:
- Restaurants
- Sporting events
- Weddings
- Parties
- Holidays
- Social gatherings
Yet a meaningful minority of people still abstain for religious, medical, personal or recovery-related reasons.
There are also strong differences between demographic groups.
And once again, someone who drank alcohol earlier in life but stopped completely does not count as a lifetime abstainer.
That person belongs in WHO’s “former drinker” category.
Latin America Generally Shows Lower Lifetime Abstinence
Much of Latin America also appears toward the lower-abstinence end of the map.
Alcoholic drinks have important cultural roles across the region.
Examples range from:
- Beer
- Wine
- Rum
- Tequila
- Cachaça
- Pisco
But national consumption patterns differ considerably.
Argentina’s wine culture is very different from Mexico’s drinking traditions.
Brazil is different again.
And Indigenous, religious and regional communities can have very different practices within the same country.
So the blue color should never be read as:
“Everybody drinks.”
It simply means a relatively smaller share reports never having consumed alcohol.
East Asia Contains Several Very Different Drinking Cultures
China, Japan and South Korea generally appear much closer to Europe than to the high-abstinence countries of the Middle East.
All three have major alcohol traditions.
China has baijiu and numerous regional drinks.
Japan has sake, shōchū, beer and a strong after-work drinking tradition.
South Korea is famous for soju and social drinking associated with workplace and dining culture.
Yet patterns have changed over time as younger generations alter their drinking habits.
Again, these maps are snapshots.
Culture is not frozen.
Australia and New Zealand
Australia and New Zealand also show low lifetime abstinence.
Both inherited strong European drinking traditions and have well-established beer and wine industries.
Australia is one of the world’s important wine producers.
New Zealand has also built a globally recognized wine industry.
But governments in both countries have simultaneously developed extensive alcohol-health policies.
This demonstrates another important point:
A country can have widespread drinking while also regulating and attempting to reduce alcohol-related harm.
Why Religion Is Powerful—but Not the Whole Story
The geographical correlation between Muslim-majority societies and high abstinence is impossible to miss.
WHO explicitly identifies cultural and religious factors as major drivers of global differences. (Iris)
But religion is not destiny.
People belonging to the same religion behave differently depending on:
- Country
- Family
- Community
- Age
- Gender
- Legal environment
- Urbanization
- Income
- Personal belief
Likewise, people outside religions that prohibit alcohol may choose abstinence for many reasons.
Some are recovering from alcohol-use problems.
Some dislike alcohol.
Some avoid it for athletic reasons.
Some are pregnant.
Some take medications incompatible with alcohol.
Others simply choose not to drink.
A behavioral map should therefore never become a stereotype map.
Laws Can Dramatically Change the Environment Around Alcohol
Government policy also matters.
Countries can control alcohol through:
- Minimum drinking ages
- Taxation
- Licensing
- Advertising restrictions
- Retail-hour restrictions
- Government monopolies
- Partial prohibition
- Complete prohibition
WHO reports that social norms, economic development, alcohol availability, and the implementation and enforcement of alcohol policies all influence consumption patterns. (World Health Organization)
Price matters.
Availability matters.
Advertising matters.
Culture matters.
Those factors interact.
Why Survey Data May Underestimate Drinking
Lifetime abstinence sounds simple:
“Have you ever consumed alcohol?”
But even that question has complications.
In societies where drinking is illegal or heavily stigmatized, respondents may not want to admit consuming it.
There can also be differences in what people consider “alcohol.”
A person may not count:
- Traditional fermented drinks
- Home-produced beverages
- Ceremonial consumption
- A single childhood sip
in the same way researchers do.
WHO uses representative surveys and statistical procedures to improve comparability, but no global behavioral dataset is perfect. (World Health Organization)
That is particularly important when comparing countries separated by only one or two percentage points.
Ranking Saudi Arabia at 92% and Iran at 91%, for example, implies more precision than survey estimates may justify.
The regional pattern is much more reliable than tiny differences between neighboring ranks.
Recorded Alcohol Sales Can Also Miss Reality
There is another measurement problem.
Not all alcohol is captured in official sales records.
WHO distinguishes between recorded and unrecorded alcohol.
Unrecorded alcohol can include:
- Homemade production
- Informally sold beverages
- Smuggled alcohol
- Alcohol produced outside taxation systems
WHO estimates that unrecorded consumption accounted for roughly 21% of worldwide total alcohol consumption in 2019. (World Health Organization)
This matters especially in places where legal sales are restricted.
Very low official alcohol sales do not necessarily mean absolutely no consumption occurs.
Alcohol Consumption Also Has Major Health Consequences
The map is primarily cultural and demographic, but there is a public-health reason WHO tracks these indicators.
WHO estimates that alcohol caused approximately 2.6 million deaths worldwide in 2019.
That included deaths related to:
- Noncommunicable diseases
- Cancer
- Cardiovascular disease
- Injuries
- Communicable diseases
Around 400 million people aged 15+ were estimated to have alcohol-use disorders, including about 209 million living with alcohol dependence. (World Health Organization)
WHO emphasizes that risk increases with both total amount consumed and harmful drinking patterns, particularly heavy episodic and sustained heavy drinking. (World Health Organization)
So while this map is about abstinence, the broader dataset exists because alcohol consumption has substantial public-health consequences.
The World Is Divided Less by Latitude Than by Culture
Many world maps follow obvious physical geography.
Rainfall maps follow climate.
Vegetation maps follow temperature and water.
Population maps follow fertile plains and cities.
This alcohol map is different.
Saudi Arabia and Mexico can have similarly warm climates but completely different drinking cultures.
Spain and Morocco sit only kilometers apart across the Strait of Gibraltar, yet their social relationships with alcohol differ sharply.
Indonesia and Australia share part of the same broad region but appear on opposite sides of the abstinence spectrum.
This map therefore represents something geography alone cannot explain.
It is a map of human culture layered onto geography.
The Most Important Distinction
If there is one thing to remember when reading the infographic, it is this:
“Never drank alcohol” is not the same as “doesn’t currently drink alcohol.”
A person who drank years ago and later stopped is a former drinker.
A lifetime abstainer has never consumed alcohol at all.
WHO deliberately separates the categories because they answer different questions. (World Health Organization)
That makes lifetime abstinence particularly interesting.
It measures something deeper than current behavior.
It reflects the accumulated influence of culture, law, family and personal choice across an entire lifetime.
The Bigger Story Behind the Map
Look at the global pattern again.
The highest-abstinence zone stretches from:
North Africa → Middle East → South Asia → parts of Southeast Asia.
Much of Europe, the Americas, Australia and East Asia sits at the opposite end.
That division reflects centuries of divergent religious traditions, social norms, laws and histories surrounding alcohol.
And yet it is changing.
Migration brings different drinking cultures together.
Tourism expands access.
Younger generations reinterpret traditions.
Governments change regulations.
Some people stop drinking for health reasons.
Others begin drinking in societies where it was once rare.
No alcohol map remains accurate forever.
But for now, the broad geographical divide is remarkably clear:
In some parts of the world, drinking alcohol is considered an ordinary part of adult social life.
In others, never drinking at all is the norm.
That may be one of the strongest examples of how culture can produce completely different everyday behaviors across the same planet.
Source & Accuracy Note
WHO defines a lifetime abstainer as someone aged 15+ who reports never having consumed alcohol. The indicator is derived primarily from representative population surveys and may use different survey years and estimation procedures across countries. WHO’s 2024 Global Status Report on Alcohol and Health and Treatment of Substance Use Disorders uses 2019 for its latest globally comparable estimates of many drinking indicators and reports that 56% of adults worldwide abstained during the previous 12 months that year. (World Health Organization)
For this infographic, I would therefore change “2020–2022” to “latest available WHO estimates” unless you verify the reference year for every country, and I would verify the exact top-country percentages before publication.