
Look at a map of the United States and it is easy to assume that population is spread somewhat evenly across the country.
It isn’t.
A huge block of the American West and Great Plains—covering more than half of the country’s land area—contains only about 47.5 million people.
Meanwhile, the rest of the country contains roughly 294 million.
That means an enormous portion of the United States has less than one-sixth of the nation’s population, while the much smaller remaining land area contains the overwhelming majority of Americans.
The contrast is one of the clearest examples of how misleading physical size can be when looking at a political map.
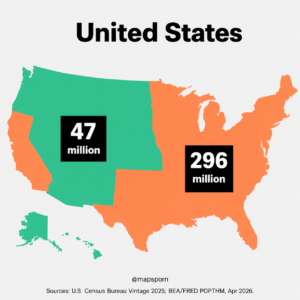
What Exactly Does the Map Show?
The green region consists of these 16 states:
- Alaska
- Hawaii
- Washington
- Oregon
- Idaho
- Nevada
- Utah
- Arizona
- Montana
- Wyoming
- Colorado
- New Mexico
- North Dakota
- South Dakota
- Nebraska
- Kansas
California is deliberately left out of the green region despite being on the Pacific Coast because its enormous population would dramatically change the comparison.
Using the U.S. Census Bureau’s July 1, 2025 population estimates, these 16 states together had approximately:
47.5 million people
The rest of the United States—34 states plus Washington, D.C.—contained approximately:
294.3 million people.
The entire U.S. resident population was estimated at 341,784,857 on July 1, 2025.
In percentage terms, the contrast is even more striking.
The green states contained only about:
13.9% of the U.S. population
while the rest of the country contained:
86.1%.
But the Green Region Covers More Than Half the Land
Population is only half of the story.
The 16 green states together cover approximately 1.9 million square miles of land.
The United States as a whole contains about 3.53 million square miles of land.
That means the green states account for roughly:
54% of the country’s land area.
Yet only about 14% of Americans live there.
So, very roughly:
54% of the land → 14% of the people
46% of the land → 86% of the people
That is the real message behind the map.
The Population Density Difference Is Enormous
If we divide population by land area, the contrast becomes even clearer.
The green region averages only about:
25 people per square mile
The rest of the country averages approximately:
180 people per square mile
So the orange portion of the map is, on average, about seven times more densely populated.
Of course, averages hide enormous local differences.
Cities such as Seattle, Denver, Phoenix and Las Vegas are extremely urbanized despite being located within the lightly populated green region.
Meanwhile, parts of Maine, Appalachia and the rural South are sparsely populated despite being on the orange side.
Still, the overall national pattern is unmistakable.
The Census Bureau itself notes that population density has historically been much higher along the Eastern Seaboard and Pacific Coast and lower across large portions of the interior West.
California Almost Breaks the Map by Itself
The decision to color California orange is crucial.
California had approximately 39.36 million residents in 2025.
Compare that with the entire green region:
California: 39.36 million
16 green states combined: 47.52 million
In other words, California alone has more than 80% as many people as all 16 green states combined.
And California occupies only about 156,000 square miles of land.
The green group occupies roughly 1.9 million square miles.
So a comparatively narrow strip of the Pacific Coast contains almost as many people as a region more than ten times larger.
California Isn’t Even America’s Only Population Giant
California is only one of several massive population centers on the orange side.
According to the 2025 Census estimates:
California — 39.4 million
Texas — 31.7 million
Florida — 23.5 million
New York — 20.0 million
Together, those four states alone contain roughly 114 million people.
That is more than twice the population of all 16 green states combined.
And then the orange region still includes other heavily populated states such as:
- Pennsylvania
- Illinois
- Ohio
- Georgia
- North Carolina
- Michigan
- New Jersey
- Virginia
- Massachusetts
This is why the 296-million side becomes so large so quickly.
Why Is the American West So Empty?
The answer isn’t one single thing.
It is a combination of climate, water, geography, settlement history and economics.
Perhaps the most important geographical factor is water.
Much of the interior western United States is considerably drier than the East.
For more than a century, geographers have used approximately the 100th meridian as a rough dividing line between the wetter eastern United States and the more arid or semiarid West.
The boundary isn’t exact, but it represents a real climatic transition.
USGS historical research describes the 100th meridian as an approximate dividing zone between humid eastern regions and the drier lands farther west.
That matters because large permanent populations need reliable water.
Less Rain Means Settlement Works Differently
Eastern North America receives comparatively abundant rainfall across huge areas.
That allowed agriculture to develop without massive irrigation systems.
Rivers were plentiful.
Forests were widespread.
Farmland supported dense networks of:
- Towns
- Farms
- Roads
- Railroads
- Industrial cities
Much of the western interior works differently.
Large areas experience:
- Low rainfall
- Desert conditions
- Semiarid grasslands
- Long distances between dependable water sources
- Recurring drought
- Heavy dependence on irrigation
USGS has long emphasized that water availability is one of the fundamental challenges of settlement and growth in the western United States.
That doesn’t prevent enormous cities from existing in the West.
It does, however, encourage people to cluster around relatively limited locations where water, infrastructure and economic opportunities are available.
That’s Why Western Population Often Looks Like Islands
Think of the population geography of the West.
Colorado has millions of people, but a large share live around the Denver–Front Range corridor.
Nevada has a substantial population, but much of it is concentrated around Las Vegas and Reno.
Arizona has more than 7.6 million residents, yet the Phoenix metropolitan region accounts for a huge portion of the state.
Utah’s population is heavily concentrated along the Wasatch Front.
Washington’s population clusters strongly around the Puget Sound region.
So a state can contain millions of people while still having enormous stretches of lightly populated land.
Mountains Also Matter
The western United States contains some of North America’s largest mountain systems.
These include:
- Rocky Mountains
- Cascades
- Sierra Nevada
- Basin and Range Province
- Numerous smaller mountain ranges
Mountainous terrain makes large-scale settlement more difficult.
Building roads, railways, utilities and housing is more expensive.
High elevations create shorter growing seasons.
Some areas receive heavy snow.
Others are isolated by steep terrain.
The result is a population pattern where large valleys and metropolitan corridors may be densely settled while the surrounding mountains remain almost empty.
Alaska Changes the Map Dramatically
Then there is Alaska.
Alaska alone has more than 571,000 square miles of land, making it by far America’s largest state geographically.
Its 2025 population?
Only about 737,000 people.
That produces an extraordinary contrast.
Alaska contains roughly 16% of America’s total land area but only around 0.2% of its population.
In 2020, Alaska’s population density was only about 1.3 people per square mile, according to Census Bureau density statistics.
Its enormous size therefore contributes heavily to the visual imbalance in the map.
Wyoming Is Another Extreme Example
Wyoming had approximately 589,000 residents in 2025.
Its land area is more than 97,000 square miles.
Its 2020 population density was only 5.9 people per square mile, one of the lowest in the country.
For comparison, millions of people can live inside a single large metropolitan county elsewhere in America.
Wyoming spreads fewer than 600,000 residents across a territory larger than many entire countries.
Montana Is Huge but Has Barely a Million People
Montana demonstrates the same pattern.
It covers around 145,550 square miles but had only about 1.14 million residents in 2025.
Montana is physically larger than Germany.
Yet Germany has more than 80 million residents.
That comparison isn’t meant to suggest the two places should have similar populations—their climates, histories and settlement patterns are completely different.
It simply illustrates how little land area tells us about population.
The Great Plains Add Even More Empty Space
The green region doesn’t stop at the Rocky Mountain states.
It also includes:
- North Dakota
- South Dakota
- Nebraska
- Kansas
These states contain large agricultural areas but relatively few major metropolitan centers.
Kansas is the largest of the four by population at roughly 3 million.
Nebraska has about 2 million.
South Dakota has fewer than 1 million.
North Dakota has around 800,000.
Together, all four contain fewer people than New York City and its immediate metropolitan surroundings.
Why Is the East So Much More Populated?
The opposite question is equally interesting.
Why did the eastern half of the country develop such a huge population advantage?
The answer begins with history.
European colonial settlement began along the Atlantic Coast.
Cities including:
- Boston
- New York
- Philadelphia
- Baltimore
- Charleston
were already major population and trading centers long before the interior West experienced large-scale American settlement.
Ports connected the colonies with Europe.
Rivers connected coastal areas to the interior.
Agriculture expanded across fertile land.
Later, industrialization created enormous cities around factories, railroads and waterways.
By the time large-scale western settlement accelerated in the 19th century, the East already had a huge demographic head start.
The Great Lakes Became Another Population Magnet
Not all dense American settlement is on the Atlantic Coast.
The Great Lakes became another enormous population zone.
Cities such as:
- Chicago
- Detroit
- Cleveland
- Milwaukee
- Buffalo
developed around manufacturing, transportation and access to inland waterways.
Chicago in particular became the transportation hub linking America’s agricultural interior with eastern markets.
This created another enormous population concentration far to the north and east of the sparsely populated Rocky Mountain region.
The South Has Become a Population Giant Too
Modern population growth has also shifted significantly toward the South.
Texas now has more than 31.7 million people.
Florida has more than 23.4 million.
North Carolina has more than 11 million.
Georgia has more than 11 million.
Recent Census estimates show particularly strong growth in states such as South Carolina, North Carolina and Texas.
So America’s population imbalance is no longer simply “old East versus empty West.”
The South and Sun Belt have become major population centers in their own right.
Most Americans Live in Urban Areas
Another key point is that Americans aren’t evenly scattered even within densely populated states.
About 80% of the U.S. population lived in Census-defined urban areas in 2020.
The country’s largest urban areas included:
- New York–Jersey City–Newark
- Los Angeles–Long Beach–Anaheim
- Chicago
- Miami–Fort Lauderdale
- Houston
- Dallas–Fort Worth
- Philadelphia
- Washington
- Atlanta
- Boston
Those metropolitan concentrations explain why large sections of the map can appear relatively empty even in states with millions of residents.
People overwhelmingly cluster in cities and suburbs rather than spreading uniformly across the landscape.
The Green Region Has Big Cities Too
It would be wrong to describe the green states as simply “empty.”
They include some of America’s fastest-growing and most important metropolitan areas.
Among them are:
- Seattle
- Portland
- Denver
- Phoenix
- Las Vegas
- Salt Lake City
- Albuquerque
- Omaha
Several green states are also growing quickly.
Idaho ranked second nationally in percentage population growth between 2024 and 2025.
Utah ranked fifth.
Washington, Arizona and Nevada were also among the ten fastest-growing states by percentage.
So the map does not mean the West isn’t growing.
It means that growth is occurring within a region so geographically enormous that even millions of new residents still leave average density relatively low.
A Surprising Comparison: 16 States Versus California
One of the easiest ways to understand the map is this:
The 16 green states together:
47.5 million people
California alone:
39.4 million people
The difference is only about 8 million.
Yet the green states stretch from Hawaii to Alaska, from Washington to Kansas and from Montana to New Mexico.
It is an immense area containing deserts, mountains, plains, forests and thousands of miles of open country.
California compresses almost the same number of people into a comparatively small section of the Pacific Coast.
47 Million People Is Still a Huge Population
It is worth remembering that 47 million people is not actually small.
If the green region were an independent country, it would have more people than countries such as:
- Canada
- Poland
- Australia
- Saudi Arabia
The reason it looks empty is simply because those 47 million people are spread across such an enormous territory.
Population density—not total population—is what creates the visual effect.
The Map’s 47 Million and 296 Million Labels
The accompanying graphic uses approximately:
47 million — green
296 million — orange
Those figures add to around 343 million, corresponding closely to the national population level used in the map’s April 2026 BEA/FRED source.
FRED reports the BEA population measure at approximately 342.68 million in April 2026 and 342.82 million by June 2026. That series includes the resident population plus members of the U.S. Armed Forces overseas.
However, state-by-state Census estimates are published annually rather than monthly.
For an apples-to-apples comparison using the same date and methodology, the July 1, 2025 Census estimates give:
Green states: approximately 47.52 million
Rest of U.S.: approximately 294.26 million
Total: approximately 341.78 million.
The slight difference does not change the geographic point of the map.
America Is Much Emptier Than Its Population Suggests
The United States is one of the world’s most populous countries.
But those hundreds of millions of people occupy the landscape very unevenly.
Huge sections of:
- Alaska
- Nevada
- Wyoming
- Montana
- New Mexico
- the Dakotas
- the Rocky Mountains
- the Great Plains
remain lightly populated.
At the same time, enormous clusters of people occupy:
- California’s metropolitan coast
- Texas’ urban triangle
- Florida
- the Northeast Corridor
- the Great Lakes
- the Southeast
That is why a population map of America can look completely different from an ordinary map of the 50 states.
The Bigger Lesson
Political maps give every square mile equal visual importance.
Population does not.
A giant state such as Wyoming can dominate a map while containing fewer people than a section of a major city.
Alaska can occupy a huge portion of a U.S. map while containing fewer residents than many metropolitan suburbs.
Meanwhile, New Jersey can appear tiny while holding more than 9.5 million people.
That’s what makes this map so striking.
More than half of America’s land can hold only about 14% of its people.
The United States may be one country politically.
Demographically, however, Americans are packed into a relatively small collection of cities, coasts, river corridors and metropolitan regions—with enormous open spaces between them.
Sources
Population figures use the U.S. Census Bureau’s Vintage 2025 Population Estimates, released in 2026. U.S. land-area figures are from Census Bureau geographic data. The map’s later national estimate references the U.S. Bureau of Economic Analysis population series distributed through FRED.