
One of the world’s biggest demographic changes is happening quietly.
Women around the world are having fewer children than previous generations.
In 1950, the global total fertility rate was close to five births per woman. By 2023, it had fallen to roughly 2.3.
And the global average hides an extraordinary divide.
In parts of Sub-Saharan Africa, fertility remains above five or six children per woman.
At the opposite extreme, places such as South Korea and Hong Kong have recorded fertility below one child per woman.
Across much of Europe, East Asia and North America, fertility has fallen below the level normally associated with long-term population replacement.
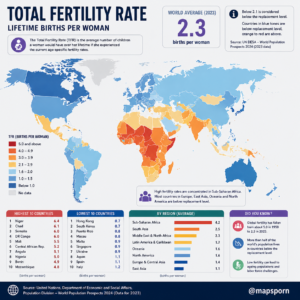
The map therefore shows much more than where families are larger or smaller.
It reveals a massive demographic transition that could reshape the world’s population, labor markets, cities and age structure during the rest of this century.
What Is the Total Fertility Rate?
The Total Fertility Rate, usually shortened to TFR, is not simply the number of children women currently have.
It is a demographic estimate representing the number of children a woman would have over her lifetime if the fertility rates observed at each age during a particular year remained constant throughout her reproductive life.
So a TFR of:
1.2
does not mean every woman literally has 1.2 children.
It means current age-specific birth rates would produce an average of about 1.2 births per woman over a lifetime.
That makes TFR useful for comparing countries and tracking changes over time.
What Does “Replacement Level” Mean?
You often hear that a fertility rate of 2.1 children per woman is needed to replace a population.
Why 2.1 rather than exactly 2?
Because not every child survives to reproductive age, and slightly more boys than girls are born.
In populations with very low mortality, roughly 2.1 births per woman is often treated as the replacement level.
But it is only an approximation.
In countries with higher child and maternal mortality, replacement fertility can be somewhat higher.
And even when fertility falls below replacement, a population does not necessarily start shrinking immediately.
If a country has a large generation of young adults entering childbearing ages, births may remain numerous for years. Immigration can also offset natural decline.
That is why fertility and population growth are connected—but they are not the same thing.
The World Average Has Fallen Dramatically
The global fertility decline is one of the most significant demographic trends of modern history.
The UN reports that global fertility fell to about 2.25 births per woman in 2024, down from 3.31 in 1990. More than half of all countries and areas are now below the 2.1 replacement benchmark. (United Nations)
The decline becomes even more striking when compared with the mid-20th century.
Around 1950, women worldwide averaged roughly five births.
Today the average is less than half that.
The change occurred within only a few generations.
Why Did Fertility Fall?
There is no single reason.
Fertility tends to decline as societies undergo what demographers call the demographic transition.
Several changes frequently occur together:
- Child mortality falls.
- Women spend longer in education.
- Urbanization increases.
- Contraception becomes more accessible.
- Marriage and childbirth happen later.
- Raising children becomes more expensive.
- Women participate more in paid employment.
- Families become less dependent on children for farm labor or old-age security.
When parents expect nearly all of their children to survive adulthood, they often choose to have fewer births.
That helps explain why fertility has fallen across extremely different societies.
Sub-Saharan Africa Remains the World’s High-Fertility Center
The darkest orange and red colors on the map are concentrated overwhelmingly in Sub-Saharan Africa.
Countries shown among the highest include:
Niger — about 6.4 births per woman
Chad — about 6.1
Somalia — about 6.0
Democratic Republic of the Congo — about 6.0
Mali — about 5.5
Central African Republic — about 5.2
Angola — about 5.1
Nigeria — about 5.0
The precise estimate changes from year to year, but the geographical pattern is very clear.
Sub-Saharan Africa remains the region where fertility is highest overall.
Why Is Fertility Higher Across Much of Africa?
Again, there is no single explanation.
In many countries, several factors overlap:
Younger marriage and childbirth
Women often begin having children at younger ages than in Europe or East Asia.
Larger desired family size
Cultural and economic preferences for larger families remain stronger in some societies.
Lower contraceptive access
Access to reliable family planning can be uneven, especially in rural areas.
Agriculture and family labor
In rural economies, larger families can historically provide economic support.
Higher child mortality
Where childhood mortality is higher, parents may have more births partly because the probability that every child survives is lower.
Lower female educational attainment
Globally, increased education for girls and women is strongly associated with later marriage and lower fertility.
These factors are changing rapidly in many African countries, which is why fertility is declining there too—just from a much higher starting point.
Niger Has One of the World’s Highest Fertility Rates
Niger frequently appears near the top of global fertility rankings.
The map gives approximately:
6.4 births per woman
Even that represents a decline from earlier decades.
Large families remain common, and Niger has one of the youngest populations in the world.
That creates enormous demographic momentum.
Even if fertility continues declining, the number of people reaching reproductive age can remain very large.
So Niger’s population may continue growing rapidly for decades.
Nigeria Matters Because of Its Size
Nigeria’s fertility rate is lower than Niger’s but still high by global standards.
The difference is scale.
Nigeria already has one of the world’s largest populations.
That means even modest differences in fertility can translate into millions of additional births.
This is one reason the United Nations expects much of future global population growth to become increasingly concentrated in Sub-Saharan Africa.
East Asia Is at the Opposite Extreme
Move to East Asia and the map changes almost completely.
Some of the world’s lowest fertility rates are found in:
- South Korea
- Hong Kong
- Japan
- China
- Singapore
The UN describes Eastern and South-Eastern Asia as containing some of the world’s lowest fertility levels. In countries whose populations have already peaked, Hong Kong and South Korea were below 0.75 births per woman in the UN’s 2024 estimates. (World Population Prospects)
A fertility rate below one is extraordinarily low.
At that level, one generation of births is dramatically smaller than the generation of potential parents before it, unless migration or a later fertility rebound changes the pattern.
South Korea: One of the World’s Most Extreme Cases
South Korea has become the best-known example of ultra-low fertility.
Why?
Researchers and policymakers frequently point to a combination of:
- Expensive housing
- Long working hours
- Competitive education
- High childcare costs
- Delayed marriage
- Career penalties associated with parenthood
- Changing attitudes toward marriage and family life
Young adults may still say they want children while delaying marriage and childbirth because they do not feel economically or socially ready.
That difference between desired fertility and actual fertility has become a major issue in many wealthy societies.
Japan Has Been Below Replacement for Decades
Japan’s fertility rate has remained below replacement level for many years.
The consequences are already visible.
Japan has:
- A rapidly aging population
- More deaths than births
- Shrinking populations in many rural areas
- Labor shortages in some sectors
- Large numbers of vacant homes
Japan shows what prolonged low fertility can eventually look like when combined with limited immigration.
But it also demonstrates that demographic change is gradual.
A society does not suddenly become empty because one year’s fertility rate is low.
Population structure changes over generations.
China Has Also Entered the Low-Fertility Era
China’s demographic story has changed dramatically.
For decades, the country was associated with concerns about rapid population growth.
Now the opposite concern dominates.
China has experienced very low fertility and its national population has entered decline.
The earlier one-child policy contributed to the country’s demographic trajectory, but removing birth restrictions did not cause fertility to rebound dramatically.
That shows an important lesson:
Once economic and social conditions produce strong preferences for small families, simply allowing more births does not necessarily lead couples to have them.
Europe Is Almost Entirely Below Replacement
Europe appears predominantly blue on the map.
Countries including:
- Italy
- Spain
- Germany
- Poland
- Greece
- Portugal
- Austria
- much of Eastern Europe
have fertility well below 2.1.
The UN says Italy and Spain are among countries experiencing “ultra-low” fertility, defined in its report as fewer than 1.4 births per woman. (United Nations)
This creates concerns about:
- Population aging
- Pension systems
- Healthcare demand
- Labor shortages
- Rural depopulation
But European demographic outcomes differ because immigration varies greatly.
Italy and Spain
Italy and Spain are among Europe’s clearest low-fertility examples.
Both combine:
- Later marriage
- Delayed first births
- Expensive housing in major cities
- Youth employment insecurity
- Difficulty combining work and family life
These countries also show why fertility is not simply about whether a society is wealthy.
High-income countries can have exceptionally low birth rates when housing, employment and family-support systems make parenthood difficult.
Ukraine’s Figure Needs Historical Context
The map places Ukraine among the world’s lowest fertility countries.
Its recent fertility statistics have been heavily affected by extraordinary circumstances, especially war, displacement and mass migration.
That makes current Ukrainian demographic figures difficult to compare with countries experiencing low fertility primarily because of long-term social and economic trends.
Wars can reduce births sharply while simultaneously changing the number and age distribution of people physically living in a country.
North America Is Below Replacement Too
Canada and the United States are shown below replacement level.
North America’s overall fertility is far below the levels recorded during the postwar baby boom.
But population can still grow despite low fertility.
The reason is mainly:
immigration.
Canada is an especially strong example.
Its fertility can remain below replacement while its population continues increasing rapidly because international migration contributes more people than natural decrease removes.
The UN expects immigration to be the main driver of population growth in dozens of countries in coming decades, including Canada and the United States. (United Nations)
Latin America Has Undergone One of the Fastest Fertility Declines
Latin America once had relatively large families.
That changed rapidly.
Countries such as:
- Brazil
- Chile
- Argentina
- Colombia
- Uruguay
now generally have fertility below replacement.
The regional transformation occurred surprisingly quickly.
Urbanization expanded.
Female education increased.
Contraception became widespread.
Families became smaller.
In countries such as Chile and Uruguay, fertility has reached levels comparable with parts of Europe.
This challenges the old assumption that very low fertility is exclusively a European or East Asian phenomenon.
India Has Crossed a Major Demographic Threshold
India was once associated with extremely rapid population growth.
Today, national fertility has fallen dramatically and is around or below replacement level depending on the estimate and year.
But India is enormous and internally diverse.
Some states have very low fertility.
Others remain significantly higher.
So a single national color hides major regional differences.
That applies to many large countries.
National averages are useful, but they can conceal enormous internal demographic variation.
Replacement Fertility Does Not Mean Zero Population Growth
Suppose a country suddenly reaches exactly 2.1 births per woman.
Would its population immediately stop growing?
No.
Imagine a country with millions of young adults and relatively few elderly people.
Even if every generation begins having replacement-level families, there may still be far more births than deaths for decades.
This phenomenon is called population momentum.
The opposite can also happen.
A country with a very old age structure may continue shrinking temporarily even if fertility rises.
Demography has built-in delays.
Why Low Fertility Leads to Population Aging
When fewer children are born each year, younger generations become smaller.
At the same time, people are living longer.
Eventually the population contains a larger proportion of older adults.
That raises the old-age dependency ratio—the number of retirees relative to people in traditional working ages.
Governments then face difficult questions.
Who will:
- Fund pensions?
- Provide healthcare?
- Work in essential industries?
- Support rural communities?
- Replace retiring employees?
Low fertility does not automatically create economic disaster.
Technology, productivity, retirement ages and immigration can all change the equation.
But it does force societies to adapt.
Is High Fertility Always Good?
No.
Very high fertility can create a different set of challenges.
If population grows faster than schools, hospitals, housing and jobs can expand, governments may struggle to provide services.
Countries with rapidly growing young populations need enormous investment in:
- Education
- Maternal health
- Childhood healthcare
- Employment
- Housing
- Infrastructure
But a youthful population can also become an economic advantage.
If young people receive good education, health care and employment opportunities, countries can experience a demographic dividend in which a large working-age population helps accelerate economic growth.
So neither “high fertility” nor “low fertility” is automatically good or bad.
The consequences depend heavily on institutions and economic conditions.
Why Governments Are Trying to Raise Birth Rates
Countries with extremely low fertility have introduced policies including:
- Child allowances
- Baby bonuses
- Subsidized daycare
- Parental leave
- Housing assistance
- Tax incentives
- Fertility-treatment support
Yet sustained fertility increases have proven difficult.
Money alone may not overcome issues such as:
- Housing shortages
- Job insecurity
- Work-family conflict
- Gender inequality at home
- Delayed partnerships
- Changing preferences about marriage and parenthood
That is why some countries have spent billions on pronatalist policies without returning anywhere near replacement fertility.
More Than Half the World Is Now Below Replacement
Perhaps the most significant statistic on the map is not the maximum or minimum.
It is how widespread low fertility has become.
The UN reports that more than half of countries and areas are below 2.1 births per woman. (United Nations)
Only a few decades ago, high fertility was the dominant demographic concern globally.
Today, the world simultaneously contains two very different realities.
Some countries are preparing for enormous population growth.
Others are trying to manage population decline.
The Global Population Can Still Grow While Fertility Falls
This sounds contradictory.
If fertility is falling almost everywhere, why is world population still increasing?
Because today’s population is extraordinarily large and relatively young in many regions.
Even with fewer births per woman, billions of people are currently in or approaching reproductive ages.
Meanwhile, life expectancy has generally risen.
The UN expects the global population to continue growing for several decades and peak around 10.3 billion in the mid-2080s under its medium projection, before gradually declining toward the end of the century. (United Nations)
So the world can experience falling fertility and continued population growth at the same time.
A Map of Two Demographic Futures
Look at the map again.
The red belt across much of Africa represents countries where populations are generally:
- Younger
- Growing quickly
- Experiencing continuing fertility decline from high levels
The deep-blue regions across Europe and East Asia represent countries where populations are generally:
- Older
- Growing slowly or shrinking
- Experiencing persistent sub-replacement fertility
Between them are countries undergoing different stages of the same broad demographic transition.
That contrast may become one of the defining global stories of the 21st century.
The Biggest Takeaway
The world’s fertility rate has fallen from around five children per woman in the middle of the 20th century to a little above two today.
But that global number hides extraordinary differences.
A woman experiencing today’s age-specific fertility rates in Niger would statistically be expected to have around six children.
In South Korea or Hong Kong, the corresponding estimate is below one.
These populations are therefore moving toward very different age structures.
Yet both high- and low-fertility countries face the same basic challenge:
How do you build an economy and society that works for the population you are actually going to have—not the population you had in the past?
That may be the most important question hidden inside this map.
Source and Method Note
The infographic uses estimates from the United Nations Department of Economic and Social Affairs, Population Division, World Population Prospects 2024, primarily referring to 2023. TFR is a synthetic period measure based on current age-specific fertility rates and should not be interpreted as the exact number of children every woman will ultimately have. The commonly cited replacement level of 2.1 is approximate and depends on mortality conditions. The UN’s updated 2024 estimate places global fertility at approximately 2.25 births per woman, with more than half of countries and areas below replacement level. (United Nations)