
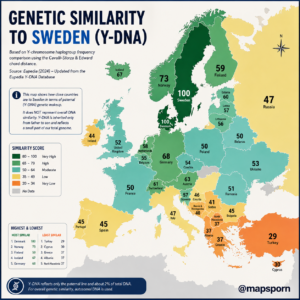
At first glance, this map seems to answer a simple question:
Which European countries are genetically closest to Sweden?
Denmark receives a score of 100.
Norway sits at 73.
Germany is 68.
Finland is 59.
France and Poland are around 50.
Turkey is only 29.
It looks like a straightforward ranking of how genetically “Swedish” different European populations are.
But that is not actually what the map measures.
The data behind it concern one very specific piece of human ancestry:
Y-DNA—the DNA passed through paternal lines.
That distinction completely changes how the map should be interpreted.
A better way to read it is:
How similar are the frequencies of major paternal Y-chromosome lineages in different European populations to those observed in Swedish male samples?
That is a much narrower—and much more interesting—question.
What Is Y-DNA?
Most of a person’s genetic ancestry comes from the 22 pairs of autosomal chromosomes inherited from both parents.
Every generation, those chromosomes recombine.
You inherit roughly half of your autosomal DNA from your mother and half from your father, but the pieces get shuffled with every generation.
The Y chromosome behaves differently.
In the typical XY inheritance pattern, a father passes his Y chromosome to his sons. Most of the Y chromosome does not recombine with the X chromosome, meaning paternal lineages can remain recognizable over many generations as new mutations gradually accumulate. (Nature)
That makes Y-DNA extremely useful for studying:
- Male-line migration
- Ancient population movements
- Founder effects
- Historical expansions
- Paternal ancestry
But it has a major limitation:
It follows only one branch of your enormous family tree.
Imagine going back ten generations.
You could theoretically have hundreds of genealogical ancestors.
Your Y chromosome follows only this chain:
father → father’s father → father’s father’s father → …
Everyone else disappears from that particular genetic record.
That is why Y-DNA should never be confused with total ancestry.
Does Y-DNA Really Represent 2% of Your DNA?
Approximately—but the wording needs care.
The human Y chromosome contains about 59 million base pairs and represents nearly 2% of the DNA in a typical male cell. (MedlinePlus)
But the haplogroup comparison shown on this map does not compare every base pair of the Y chromosome.
It uses selected genetic markers to classify paternal lineages.
So saying:
“Y-DNA represents about 2% of total DNA”
is broadly understandable.
But saying:
“This map compares 2% of the genome”
would still exaggerate how much genetic information was actually used.
The safer explanation is:
Y-DNA tracks the direct paternal lineage and represents only a tiny fraction of a person’s total ancestry.
What Is a Y-DNA Haplogroup?
A haplogroup is essentially a major branch of humanity’s genetic family tree.
Over thousands of years, mutations occurred in different paternal lineages.
Researchers can use those mutations to classify Y chromosomes into branches with names such as:
- I1
- R1a
- R1b
- N
- I2
- E
- J
These are not nationalities.
There is no “Swedish gene,” “German gene” or “Greek gene.”
The same haplogroup can appear across numerous countries.
What changes is the frequency.
For example, Sweden has historically shown high frequencies of Y-chromosome haplogroup I1, along with substantial R1a and R1b components and smaller contributions from other paternal lineages. A peer-reviewed Swedish study found I1 to be the most common major paternal lineage and reported that I1, R1b, R1a and N together accounted for more than 80% of sampled male lineages. (Nature)
It is those frequency mixtures that maps like this compare.
Sweden and Denmark: Close, but Not “100% the Same”
The map labels Denmark:
100
That is potentially misleading.
Sweden and Denmark absolutely are genetically close populations.
Whole-genome research confirms that Danish samples cluster near Swedish and Norwegian samples, with substantial overlap among Scandinavian populations. (OUP Academic)
But Denmark’s Y-DNA distribution is not identical to Sweden’s.
The Eupedia table cited by maps of this type gives approximately:
Sweden
- I1: 37%
- R1a: 16%
- R1b: 21.5%
- N1c1: 7%
Denmark
- I1: 34%
- R1a: 15%
- R1b: 33%
- N1c1: 1% (Eupedia)
Those are clearly related populations.
They are not identical distributions.
Therefore a score of 100 should not be read as “100% genetically identical to Swedes.”
If Denmark received 100 because the creator rescaled the closest comparison to equal 100, that needs to be stated clearly.
Otherwise readers may interpret the number as a literal DNA percentage.
Norway: Another Close Scandinavian Neighbor
Norway’s high placement makes broad historical sense.
Norwegian and Swedish populations share many major northern European paternal lineages.
The same Eupedia dataset shows Norway dominated by I1, R1b and R1a—the same three major categories prominent in Sweden, although at different frequencies. (Eupedia)
Large whole-genome analyses also place Scandinavian populations near one another.
In a study examining more than 100,000 SNPs, Danish samples partially overlapped genetically with Norwegians and Swedes. (OUP Academic)
This illustrates something that appears throughout European population genetics:
genetic geography tends to be gradual.
Crossing a political border rarely creates a sudden genetic break.
Neighboring populations usually overlap.
Finland: Close Geographically, Different Paternal History
Finland is particularly interesting.
It borders Sweden and shares centuries of history with it.
Yet Finland’s paternal-line profile differs considerably.
One major reason is haplogroup N, which is much more frequent among Finnish men than among Swedish men.
Older academic Y-chromosome surveys likewise found N3—an older designation within what is now the N lineage—extremely common among Finns while Swedish paternal samples contained considerably more haplogroup I. (PubMed Central (PMC))
Whole-genome studies also repeatedly identify Finland as somewhat distinctive within northern Europe.
A broad European analysis found Finnish samples forming one of the more recognizable poles of European genetic structure, although Europeans overall remain genetically very similar. (PubMed Central (PMC))
This makes Finland an excellent demonstration of why:
geographic closeness does not always produce identical ancestry patterns.
Historical founder effects, population size and migration also matter.
Iceland: The Viking Story Written Into Y-DNA
Iceland’s position on a Y-DNA map is especially fascinating because historians already know much about its settlement.
Iceland was primarily settled during the Viking Age by people originating from Scandinavia and the British Isles.
Y-chromosome studies estimated that roughly 75–80% of Iceland’s founding paternal ancestry was Scandinavian, while around 20–25% was Gaelic. (PubMed)
But mitochondrial DNA—which follows the maternal line—tells a different story.
Studies estimated that only about 37% of Icelandic maternal ancestry came from Scandinavia, with much of the remainder associated with the British Isles. (PubMed Central (PMC))
So ancient Iceland illustrates exactly why Y-DNA cannot equal overall ancestry.
A simplified historical picture is:
many founding male lines → Scandinavian
while
many founding female lines → Gaelic/British Isles
The modern Icelandic population inherited both.
A Y-DNA-only map sees mainly the first story.
Germany and the Netherlands
Germany receives a relatively high score on the infographic, while the Netherlands is also shown as closer to Sweden than many southern European countries.
That broad pattern is plausible for northern European paternal ancestry.
Germany, the Netherlands, Denmark, Sweden and surrounding areas share substantial frequencies of haplogroups such as I1 and R1b.
But once again, whole-genome evidence provides the more complete picture.
A genomic study of Denmark found Danes genetically close not only to Norway and Sweden but also to samples from:
- Great Britain
- Netherlands
- Germany
- Poland (OUP Academic)
European populations do not sit in isolated biological boxes.
They form overlapping geographical gradients.
Britain and Ireland
The map shows the United Kingdom as moderately similar to Sweden but Ireland considerably lower.
Y-DNA helps explain part of that pattern.
Ireland contains an especially high frequency of R1b paternal lineages compared with Scandinavia.
Older studies comparing North Atlantic populations found approximately 82% of sampled Irish Y chromosomes in one major R1b-associated grouping, compared with a much more mixed Scandinavian paternal profile. (PubMed Central (PMC))
Yet Viking settlement did leave measurable Scandinavian paternal ancestry in parts of Britain and Ireland.
Research has found significant Norse paternal contributions particularly in places such as:
- Orkney
- Shetland
- Western Scottish islands
with the strongest Scandinavian Y-chromosome contribution in the North Atlantic islands. (Nature)
So a national UK average hides substantial regional differences.
The Baltic States
Estonia, Latvia and Lithuania sit geographically between Scandinavia and eastern Europe.
Their Y-DNA reflects that position.
Baltic paternal populations contain substantial frequencies of:
- R1a
- N
- smaller amounts of I and R1b
but in different proportions from Sweden.
Academic comparisons have found N lineages particularly prominent in Estonia and Latvia, while R1a becomes increasingly important across much of eastern Europe. (PubMed Central (PMC))
The result is moderate Y-DNA similarity to Sweden without an identical paternal history.
Poland, Belarus and Ukraine
Move farther east and R1a becomes particularly prominent.
Older academic samples reported R1a frequencies around:
Poles — roughly 56%
Ukrainians — roughly 54%
while Swedish populations had a much more mixed combination of I, R1a, R1b and N lineages. (PubMed Central (PMC))
So Sweden and eastern Europe share some ancient paternal branches.
But the proportions differ.
That is precisely what a haplogroup-frequency distance measures.
It is not asking:
“Do Swedes and Poles share ancestors?”
Of course they do.
Instead it asks something closer to:
“How similarly distributed are selected paternal-line branches in sampled populations today?”
Southern Europe
The infographic gradually shifts toward lower similarity scores in:
- Spain
- Portugal
- Italy
- Greece
- Balkans
- Turkey
Again, that does not mean these populations possess only “45% of Swedish DNA.”
That interpretation would be scientifically wrong.
Rather, southern European male populations contain different mixtures of major Y-DNA haplogroups.
For instance, R1b is extremely frequent throughout much of Iberia and Western Europe, while E1b1b, J2 and other lineages become more prominent in parts of Italy, Greece and southeastern Europe.
Eupedia’s frequency table illustrates these broad differences, although its figures should be regarded as an aggregated secondary dataset rather than a definitive national census. (Eupedia)
Why Turkey Appears Farther Away
Turkey receives the lowest score on the map.
Its paternal-line composition includes considerable frequencies of J2, R1b, G2a, J1, E1b1b and several other lineages.
That mixture differs substantially from Sweden’s strong I1-centered profile. (Eupedia)
But once again:
29 does not mean Turkish people are “29% genetically similar” to Swedish people.
All human populations share the overwhelming majority of their DNA.
This number is only meaningful within whatever custom Y-haplogroup-frequency calculation produced the map.
Calling it a percentage of DNA similarity is incorrect.
What Is Cavalli-Sforza–Edwards Chord Distance?
The map says it uses Cavalli-Sforza and Edwards chord distance.
That is a real population-genetics method.
It treats populations as points defined by allele frequencies and calculates a mathematical distance between them.
Smaller distance means more similar frequency distributions.
Larger distance means more different distributions. (Wiley Online Library)
But there is an important complication.
Research comparing different genetic-distance methods has shown that results can vary depending on which metric is selected. One study using whole-genome SNP data found Cavalli-Sforza–Edwards distance among the measures that differed most from several alternatives. (PubMed)
So even a properly calculated genetic distance is not an absolute measure of:
“how genetically similar two nations are.”
It is a statistical tool whose interpretation depends on:
- which genetic markers were chosen
- which individuals were sampled
- sample sizes
- how haplogroups were categorized
- which mathematical distance was used
And this map adds another layer by apparently converting that distance into an unexplained 0–100 “similarity score.”
What Would Whole-Genome DNA Show?
If the goal is genuinely comparing overall population genetic similarity, researchers normally examine hundreds of thousands—or millions—of autosomal SNPs spread across the genome.
When scientists do that in Europe, one striking pattern appears:
genes broadly mirror geography.
A famous Nature study examined hundreds of thousands of genetic markers in European individuals and found that a two-dimensional genetic plot resembled the geographic map of Europe.
Neighboring populations generally clustered near each other.
But the study also emphasized that average genetic differentiation among Europeans is low. (Nature)
That is a much better representation of European population genetics than imagining countries as genetically isolated blocks.
National Borders Are Not Genetic Walls
The crisp borders on this infographic are necessary to make the map readable.
Biology does not follow them.
A person from northern Germany may share more recent regional ancestry with someone from Denmark than with someone from southern Germany.
Northern Swedes can differ somewhat from southern Swedish populations.
Research within Sweden has detected regional Y-chromosome variation, including differences involving northern populations. (Nature)
Whole-genome studies have likewise detected fine-scale genetic variation even inside relatively small European regions. (PubMed Central (PMC))
So phrases such as:
“Swedish DNA”
or
“German genetics”
are useful shorthand for population-level statistics.
They are not discrete biological categories.
What This Map Is Actually Good For
With the right explanation, the infographic tells a genuinely interesting story.
It can illustrate how paternal lineages broadly reflect:
Geography
Neighboring populations often have related Y-DNA frequency distributions.
Migration
Viking movements left paternal genetic signatures around the North Atlantic.
Founder effects
Some populations experienced demographic events that amplified particular male lineages.
Historical isolation
Finland and Iceland both demonstrate how population history can make lineage frequencies distinctive.
Male-biased migrations
Because Y-DNA follows fathers, migrations dominated by men can leave especially strong Y-chromosome signals.
That makes Y-DNA an extraordinary tool for reconstructing history.
It just isn’t a complete map of ancestry.
The Biggest Lesson
A man could have a Swedish-style Y-chromosome lineage while the overwhelming majority of his genealogical ancestry comes from somewhere else.
Or he could have one paternal lineage rare in Sweden while most of his autosomal ancestry is closely related to Scandinavian populations.
Both are entirely possible.
That is why professional population genetics uses multiple kinds of evidence.
Y-DNA follows paternal ancestry.
Mitochondrial DNA follows maternal ancestry.
Autosomal DNA captures contributions from many ancestral lines and is much more appropriate for broad overall genetic comparisons.
Put all three together—and combine them with archaeology, history and ancient DNA—and the story becomes much richer.
Final Thought
The interesting message of this map is not:
“Danes are 100% Swedish and Turks are only 29% Swedish.”
That would be incorrect.
The real story is:
Paternal lineages vary geographically across Europe, and Sweden’s particular mix of Y-chromosome haplogroups is most similar to other northern European populations and progressively different from many populations farther south and east.
That pattern reflects thousands of years of migration, isolation, population expansion and historical contact.
Y-DNA gives us one narrow window into that history.
A fascinating window—but only one window.
Source & Accuracy Note
The infographic appears to derive its haplogroup frequencies from Eupedia’s compiled European Y-DNA database and then apply or reference Cavalli-Sforza–Edwards chord distance. Eupedia lists Sweden, Denmark, Norway and other countries with clearly different haplogroup frequency distributions, so the map’s 0–100 numbers should not be presented as percentages of shared DNA. (Eupedia)
I would change the legend from “Similarity Score” to:
Relative similarity of Y-DNA haplogroup frequencies to Sweden — custom index, not percent DNA shared.
And I would remove or explain Denmark = 100 unless the creator can provide the exact transformation used to turn chord distances into those scores.