
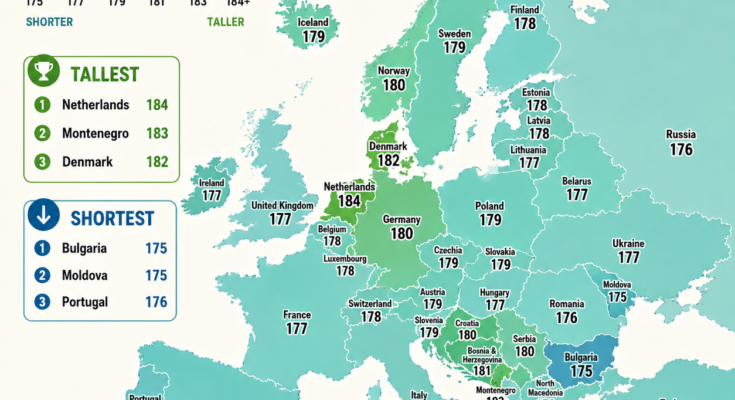
Europe contains many of the tallest populations on Earth.
Travel from Portugal or southern Italy toward the Netherlands, Scandinavia or parts of the Balkans and the difference in average height becomes noticeable.
The Netherlands has become especially famous for tall people. Dutch men born in 1996 were estimated to average around 182.5 centimeters, or almost 6 feet tall.
Several other European populations are close behind.
Belgium, Estonia, Latvia and Denmark all exceeded an average of roughly 181 centimeters in the major NCD Risk Factor Collaboration dataset. Bosnia and Herzegovina, Croatia and Serbia were also among Europe’s taller populations. (Our World in Data)
But why?
Why should average male height vary by several centimeters between countries that are sometimes only a short drive apart?
The answer is much more complicated than genetics.
Height reflects a combination of biology, nutrition, childhood health, living standards and historical conditions.
And that makes Europe’s height map surprisingly revealing.
What Does “Average Male Height” Actually Mean?
An average national height does not describe every man in that country.
If the average height is 180 centimeters, millions of men will be shorter and millions will be taller.
The number simply represents the statistical mean of a population.
It is also important to compare similar age groups.
People tend to lose some height as they grow older, so comparing a country with a young sample to one with a much older population can distort the result.
That is why the NCD-RisC dataset estimated height by birth cohort.
Its widely cited international comparison examined people born from 1896 through 1996 across 200 countries and territories, using 1,472 population-based studies involving more than 18.6 million participants. (eLife)
For the latest cohort in that particular dataset, the researchers estimated the adult height attained by people born in 1996.
That is the dataset behind the figures commonly shown by Our World in Data.
The Netherlands: Europe’s Tallest Men
The Netherlands stands at the top.
The NCD-RisC estimate for Dutch men born in 1996 is:
182.54 cm
That’s approximately:
5 feet 11.9 inches.
The study concluded that Dutch men were the tallest male population in the world among that cohort. (eLife)
But the Netherlands was not always the world leader.
One of the most fascinating parts of the data is how dramatically Dutch height increased during the 20th century.
Men born in the Netherlands in 1896 averaged roughly 169.4 cm.
Those born a century later averaged about 182.5 cm.
That’s an increase of approximately:
13 centimeters. (Our World in Data)
Genetics cannot explain such a dramatic change over only a few generations.
The Dutch gene pool did not suddenly transform.
Instead, improved living conditions allowed more people to reach their biological growth potential.
Belgium Is Surprisingly Close
Belgium is one of the countries that the infographic underestimates.
According to NCD-RisC data, Belgian men born in 1996 averaged approximately:
181.7 cm.
That actually places Belgium above Denmark in this dataset. (Our World in Data)
Belgium’s rise is also remarkable historically.
Over the century examined by researchers, average male height increased by about 14.5 cm.
That makes Belgium an excellent example of how economic development, nutrition and childhood health can transform average physical development within a population. (Our World in Data)
Estonia and Latvia Are Among Europe’s Tallest
Another surprising feature of the reliable dataset is the Baltic region.
Estonian men born in 1996 averaged about:
181.6 cm
while Latvian men averaged roughly:
181.4 cm.
Both rank among the tallest populations in the dataset. (Our World in Data)
This means the map’s values of roughly 178 cm for both countries significantly underestimate the NCD-RisC figures it claims to use.
Lithuania is somewhat lower but still tall by global standards, at about 179 cm.
Europe’s height geography is therefore not simply a Scandinavian phenomenon.
The Baltic region is highly prominent too.
Denmark
Denmark has long had a reputation for tall people, and the data support it.
The NCD-RisC estimate is approximately:
181.4 cm
for men born in 1996. (Our World in Data)
That still makes Danish men exceptionally tall internationally.
However, the infographic’s claim that Denmark is clearly Europe’s third-tallest country depends on which dataset is being used.
In the NCD-RisC comparison, Belgium, Estonia and Latvia are slightly ahead.
This highlights an important lesson:
height rankings can change depending on the dataset, survey year and age group.
A difference of half a centimeter should never be treated as if it were an enormous biological distinction.
What About Montenegro?
This is probably the biggest issue in the infographic.
Montenegro is labeled at:
183 cm
and ranked second in Europe.
There are indeed regional anthropometric studies suggesting extremely tall populations in Montenegro and the broader Dinaric Alps, and certain local samples can reach averages around or above 183 cm.
But that is not the number in the NCD-RisC/Our World in Data source printed on the map.
That source estimates Montenegro at around:
178.3 cm. (Our World in Data)
Therefore you have two legitimate options for the infographic.
Either use the NCD-RisC international dataset consistently.
Or use newer/regional anthropometric studies for Balkan countries—but then the source and methodology must be changed accordingly.
Mixing the two creates misleading rankings.
The Balkans Still Stand Out
Even without the incorrect Montenegro number, parts of the western Balkans are known for very tall populations.
NCD-RisC estimates include approximately:
Bosnia and Herzegovina — 180.9 cm
Croatia — 180.8 cm
Serbia — 180.6 cm
Slovenia — 179.8 cm. (Our World in Data)
Other research focusing specifically on the Dinaric Alps has sometimes produced even higher measurements.
This has made the region particularly interesting to researchers studying human height.
The concentration of tall populations around Bosnia, Croatia and Montenegro suggests that both genetic background and environmental conditions play roles.
But neither factor alone explains the entire pattern.
Germany and Central Europe
German men in the NCD-RisC data averaged approximately:
179.9 cm.
Czech men averaged around:
180.1 cm.
Slovenia was about:
179.8 cm.
Slovakia around:
179.5 cm. (Our World in Data)
These countries sit close to the upper end of global male height even if they do not receive the attention given to the Netherlands.
This is one reason Europe dominates the top of international height rankings.
The original NCD-RisC study noted that men born in 1996 exceeded 181 cm on average in the Netherlands, Belgium, Estonia, Latvia and Denmark, and that Europe supplied almost all of the world’s tallest male populations. Australia was the only non-European country among the top 25 in that analysis. (eLife)
Scandinavia Is Tall—but Not Uniformly So
Scandinavia is often stereotyped as a region of extremely tall people.
There is truth behind that stereotype, but the differences between Nordic countries are smaller than people imagine.
The NCD-RisC estimates are roughly:
Norway — 179.8 cm
Sweden — 179.7 cm
Finland — 179.6 cm
Denmark — 181.4 cm
Iceland — 180.5 cm. (Our World in Data)
All are tall internationally.
But Denmark stands noticeably above Finland, Sweden and Norway in that dataset.
Again, national boundaries do not create sharp biological borders.
There is enormous overlap among neighboring populations.
Southern Europe Has Become Much Taller
Italy, Spain, Portugal and Greece traditionally averaged shorter heights than northern Europe.
But one of the most important stories is how rapidly that gap narrowed.
The NCD-RisC study found especially large height gains across parts of southern Europe during the 20th century. (eLife)
Greece was particularly dramatic.
Men born in 1996 were estimated to be roughly 14.8 cm taller than men born a century earlier.
Spain gained about 14.3 cm.
Portugal gained almost 14 cm.
Italy gained roughly 13 cm. (Our World in Data)
Those are enormous changes in biological terms.
They show how strongly childhood conditions influence adult height.
Why Did Southern Europeans Become Taller?
During the late 19th and early 20th centuries, parts of southern Europe experienced significant poverty, infectious disease and nutritional limitations.
Over the following decades:
food availability improved,
child mortality fell,
sanitation improved,
healthcare expanded,
protein consumption increased,
and living standards rose.
Children growing up under those better conditions were able to grow taller.
Height therefore acts partly as a historical record of childhood conditions.
Height Is Partly Genetic—but Environment Matters Enormously
Human height is strongly heritable at an individual level.
Tall parents are more likely to have tall children.
But that does not mean national differences can simply be explained by “tall genes.”
Our World in Data notes that genetics matters, but population-wide height differences also reflect environmental factors such as nutrition and health during pregnancy, childhood and adolescence. (Our World in Data)
The dramatic century-long increases seen in countries like the Netherlands, Belgium, Spain and Portugal prove this.
Genes change slowly.
Average national height can change surprisingly quickly.
Nutrition During Childhood
Children require adequate energy and nutrients to reach their full growth potential.
Important nutritional factors include sufficient:
protein,
calories,
vitamins,
and minerals.
Chronic undernutrition during childhood can permanently reduce adult height.
But simply eating more calories is not enough.
A diet can provide plenty of energy while still lacking important nutrients.
Childhood Disease Matters Too
Repeated infections can interfere with growth.
The body must devote energy to fighting disease rather than development.
Diarrheal diseases are especially important because they can reduce nutrient absorption.
Improvements in:
clean drinking water,
sanitation,
vaccination,
antibiotics,
and healthcare
therefore contribute indirectly to taller populations.
This helps explain why average height frequently rises as living standards improve.
Height Is Sometimes Called a Biological Standard-of-Living Indicator
Economic historians often use average height as one measure of historical living conditions.
That may seem strange.
Why not simply look at income?
Because income does not tell us everything.
A population could have rising wages while suffering from:
poor sanitation,
crowded housing,
disease,
unequal food distribution
or inadequate childhood nutrition.
Height captures some of those influences indirectly.
Our World in Data describes population height differences as reflecting not only genetics but also health, nutrition and broader living standards during development. (Our World in Data)
That makes historical height records particularly valuable in periods when reliable income statistics were unavailable.
Europe Was Not Always the Same Height
One of the most interesting mistakes people make is imagining modern height differences as permanent characteristics.
They are not.
A century ago, international rankings looked very different.
The NCD-RisC study found that men born in Sweden, Norway and the United States were among the tallest populations in the world around the turn of the 20th century.
The Netherlands later overtook them dramatically. (eLife)
Other countries climbed rapidly as childhood conditions improved.
Some populations stagnated.
That means today’s rankings are snapshots of history rather than fixed biological truths.
Why Has Dutch Height Growth Slowed?
Height cannot increase forever.
As populations approach the level permitted by their genetic potential under good nutritional and health conditions, gains naturally slow.
NCD-RisC researchers found that height increases had begun leveling off in several high-income countries. (eLife)
That is expected.
Improving childhood nutrition from severe deficiency to adequate nutrition can produce major growth gains.
Improving an already excellent diet produces much smaller effects.
So the Netherlands is unlikely to keep adding 13 centimeters every century.
The Difference Between Europe and the World
The global average height of men born in 1996 in the Our World in Data series is approximately:
171 cm.
Dutch men averaged about:
182.5 cm.
That’s a difference of more than:
11 centimeters. (Our World in Data)
The original NCD-RisC study found an even wider gap between the tallest and shortest national populations.
Dutch men born in 1996 averaged about 182.5 cm, while men in the shortest countries—including Timor-Leste, Yemen and Laos—were around 160 cm.
The international difference therefore reached approximately 22–23 centimeters. (eLife)
That is almost the length of a standard sheet of paper.
Why Country Rankings Should Be Treated Carefully
Height rankings look precise when presented as:
1st Netherlands
2nd Belgium
3rd Estonia
But the scientific estimates contain uncertainty.
The Dutch estimate of 182.5 cm, for example, came with a credible interval around 180.6–184.5 cm in the original study. (eLife)
Many countries’ ranges overlap.
Different surveys can also produce different results depending on:
age,
sample size,
region,
measurement technique,
survey year
and population coverage.
That is why it is much safer to say:
“Among Europe’s tallest populations”
rather than obsessing over whether one country is exactly 0.3 cm taller than another.
What This Map Really Tells Us
The fascinating part of Europe’s height map is not who wins first place.
It is the geographical pattern.
Northern, northwestern, Baltic and parts of southeastern Europe contain many of the world’s tallest male populations.
Southern Europe has experienced enormous height gains during the past century.
And differences between generations demonstrate that height is not simply predetermined by ancestry.
It reflects the conditions in which children grow up.
A country’s average height therefore contains traces of:
its diet,
its public-health system,
its history of disease,
its economic development
and its living standards.
A seemingly simple map of centimeters becomes a map of European social history.
Final Thought
When people hear that Dutch men are among the tallest in the world, the usual explanation is:
“It’s genetics.”
Genetics certainly matters.
But the historical data make something very clear.
Dutch men born a century apart differ by roughly 13 centimeters in average height. (Our World in Data)
That did not happen because the Dutch suddenly acquired new genes.
It happened because childhood changed.
Better nutrition.
Better sanitation.
Better healthcare.
Lower disease burdens.
Higher living standards.
The map therefore reveals something far more interesting than which Europeans are tallest.
Human height is partly a biological inheritance—but it is also a record of the world we grow up in.
Source & Accuracy Note
If this infographic is intended to use the NCD Risk Factor Collaboration / Our World in Data source printed at the bottom, several numbers should be corrected. The latest cohort in the widely cited OWID adult-height dataset consists of men born in 1996, who reached age 18 in 2014. The estimates include the Netherlands 182.54 cm, Belgium 181.70, Estonia 181.59, Latvia 181.42, Denmark 181.39, Bosnia and Herzegovina 180.87, Croatia 180.78, Serbia 180.57, and Montenegro 178.28 cm. (Our World in Data)
So I would not publish the current “Netherlands 184 / Montenegro 183 / Denmark 182” top-three ranking while citing NCD-RisC, because those numbers come from a different methodology or dataset.