
Europe may look like one closely connected smartphone market, but the continent is deeply divided when it comes to mobile operating systems.
In May 2026, Apple’s iOS accounted for approximately 42.4% of European mobile web usage, while Android held around 57.6%.
So Android remained Europe’s larger mobile operating system overall.
But looking at individual countries reveals a completely different story.
In Switzerland and several northern European markets, iOS approaches—or even exceeds—60% of mobile web traffic.
Move south or east, and Apple’s share can fall to around one-third or even one-quarter.
The difference is striking.
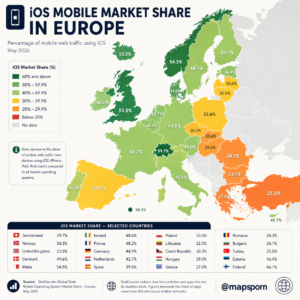
Switzerland: Nearly 60% iOS
Switzerland was one of Europe’s strongest iOS markets in May 2026.
StatCounter recorded:
iOS — 59.69%
Android — 40.29%. (StatCounter Global Stats)
That means roughly six out of every ten mobile page views measured by StatCounter in Switzerland came from devices running iOS.
Switzerland’s position is not especially surprising.
It is one of Europe’s wealthiest consumer markets, making the relatively high upfront cost of premium iPhones less of a barrier than it may be elsewhere.
Apple also benefits from an established ecosystem. Once consumers own an iPhone alongside products such as an Apple Watch, AirPods, iPad or Mac, switching to another platform can become less attractive.
But price alone cannot explain Europe’s entire map.
Denmark demonstrates that particularly well.
Denmark Was Actually Higher Than the Map Shows
The infographic lists Denmark at:
49.6%
But StatCounter’s May 2026 result was:
63.42% iOS
compared with:
36.57% Android. (StatCounter Global Stats)
That would make Denmark one of the strongest iOS markets among the European countries shown.
This is a substantial discrepancy and worth correcting before publication.
More broadly, Denmark illustrates Apple’s strength across some affluent northern European markets, where high incomes, mature mobile-contract markets and strong premium-device adoption can favor iPhones.
Norway: iOS Holds the Majority
Norway was another country where iOS led Android.
StatCounter measured:
iOS — 54.33%
Android — 45.65%. (StatCounter Global Stats)
The infographic’s 54.3% figure is therefore accurate.
Norway fits the broader pattern of comparatively high iOS usage in affluent northern European countries.
It is not an absolute rule—mobile preferences are shaped by many factors—but the geographic pattern is hard to miss.
United Kingdom: iOS Also Leads
The UK sits on the iPhone-heavy side of Europe’s divide.
In May 2026:
iOS — 53.50%
Android — 46.48%. (StatCounter Global Stats)
So Apple’s operating system represented slightly more than half of StatCounter’s measured mobile web traffic.
The UK’s relatively strong iPhone position has existed for years and benefits from a mature smartphone market where consumers frequently purchase premium phones through carrier contracts, financing or trade-in programs.
This helps reduce the importance of the phone’s full retail price at the moment of purchase.
Germany Is Almost Evenly Split
Germany presents a very different picture.
The map’s 44.9% figure is essentially correct.
StatCounter reported:
iOS — 44.89%
Android — 55.09%. (StatCounter Global Stats)
Android therefore remained ahead, but iOS still represented a very large part of German mobile web usage.
Germany is a good reminder that Europe’s mobile market is not simply:
Western Europe = Apple
and
Eastern Europe = Android.
The differences are gradual.
Germany sits somewhere between the very Apple-heavy markets farther north and the more Android-dominant markets of southern and eastern Europe.
France Needs a Major Correction
The infographic labels France at:
48.2% iOS.
But StatCounter’s actual May 2026 mobile figure was:
34.99% iOS
versus:
64.99% Android. (StatCounter Global Stats)
That is a large enough difference to materially change the visual story of the map.
France should therefore be shown much more strongly as an Android-majority country.
This is also why maps based on technology-market data need careful date and category checking.
StatCounter provides separate data for:
mobile,
tablet,
desktop,
and combined platforms.
Mixing one platform’s figure with another can produce dramatically different percentages.
Spain Is Also More Android-Heavy Than Shown
The infographic gives Spain:
39.6%.
StatCounter reports:
32.66% iOS
and:
67.33% Android for May 2026. (StatCounter Global Stats)
So roughly two-thirds of measured Spanish mobile web traffic came from Android devices during the month.
That creates a large gap between Spain and countries such as Switzerland, Denmark, Norway and the UK.
And it hints at one of the largest forces shaping Europe’s smartphone geography:
The cost of the device relative to income matters.
Apple competes overwhelmingly in the premium smartphone segment.
Android, by contrast, is available across an enormous price range.
A buyer can choose:
a low-cost Android phone,
a mid-range model,
or a premium device costing as much as an iPhone.
That gives Android manufacturers an enormous advantage in price-sensitive markets.
Romania Is Higher Than the Infographic Claims
Romania is shown at only:
24.3% iOS.
But StatCounter’s actual May 2026 figure was:
31.23% iOS
compared with:
68.66% Android. (StatCounter Global Stats)
Android still clearly dominates.
But Apple has a considerably larger presence than the infographic suggests.
A difference of seven percentage points is significant in a market-share graphic.
Türkiye: About One-Quarter iOS
Türkiye is one of the map values that checks out very closely.
StatCounter reported:
iOS — 25.50%
Android — 74.49%. (StatCounter Global Stats)
In other words, around three-quarters of measured Turkish mobile web usage came from Android.
Türkiye illustrates the importance of affordability especially clearly.
Premium electronics can become particularly expensive when local currency movements, taxes and import costs are added to already-high flagship prices.
Android manufacturers can compete at many more price levels.
Apple cannot.
What Does “Market Share” Actually Mean Here?
This may be the most important explanation to include in the article.
When StatCounter says Switzerland has 59.69% iOS market share, it does not mean:
“59.69% of Swiss residents own an iPhone.”
Nor does it mean:
“59.69% of smartphones sold in Switzerland are iPhones.”
StatCounter measures internet usage.
Its tracking code appears on more than one million websites. Each time someone loads a page, StatCounter can identify information such as the visitor’s operating system and whether the device is mobile.
Those billions of page views are then aggregated into its market-share statistics. (StatCounter Global Stats)
StatCounter specifically says it bases these figures on page views rather than unique users because it is attempting to measure usage intensity, not the number of individual device owners. (StatCounter Global Stats)
So the most technically accurate title for this map would be:
Share of European Mobile Web Usage From iOS Devices
rather than simply:
iOS Mobile Market Share.
Both are understandable, but the first tells readers exactly what is being measured.
Why Might One iPhone User Generate More Traffic Than Another?
This methodology also produces an interesting limitation.
Suppose two people own smartphones.
One Android owner loads 20 webpages during a month.
One iPhone owner loads 200.
Under a page-view-based measurement, the iPhone contributes ten times more activity.
So StatCounter’s results represent usage share, not necessarily device ownership share.
Different populations can also have different browsing habits, app usage patterns and website preferences.
For that reason, StatCounter itself says its statistics should be understood in the context of its methodology. (StatCounter Global Stats)
Why Is iOS More Popular in Some European Countries?
No single factor explains the map.
But several forces probably contribute.
Purchasing power
An iPhone represents a smaller proportion of income in wealthy countries than in lower-income markets.
Financing
Carrier contracts and installment plans can make premium phones easier to purchase.
Apple’s ecosystem
People already using Macs, AirPods, Apple Watches or iPads have additional incentives to remain with iOS.
Second-hand iPhones
Apple devices often have long useful lives and strong resale markets, allowing older iPhones to remain active for years.
Android’s enormous price range
Android exists on inexpensive entry-level models as well as ultra-premium flagship phones.
Apple does not compete seriously in the cheapest smartphone tiers.
The result is not surprising:
Where buyers are more price-sensitive, Android generally has a powerful structural advantage.
Europe Overall Still Belongs to Android
Despite Apple’s strength in several countries, Android remained comfortably ahead across Europe as a whole in May 2026.
The continental figures were:
Android — 57.58%
iOS — 42.40%. (StatCounter Global Stats)
So roughly three out of five mobile page views came from Android.
The European market therefore differs substantially depending on whether you are looking at:
Switzerland,
Denmark,
Britain,
Germany,
Spain,
Romania
or Türkiye.
There is no single “European smartphone market.”
There are dozens of national markets with different incomes, consumer preferences, carrier structures and device-buying habits.
And These Numbers Can Change Quickly
This map is specifically a May 2026 snapshot.
That should remain clearly visible.
StatCounter’s Europe-wide iOS figure dropped from 42.40% in May to 38.98% in June 2026, demonstrating that month-to-month usage data can move noticeably. (StatCounter Global Stats)
That doesn’t necessarily mean millions of Europeans suddenly threw away their iPhones.
Web-usage statistics can fluctuate because of traffic patterns, devices being used more or less frequently and changes in StatCounter’s observed sample.
For a more stable long-term comparison, averaging several months can sometimes be more informative than relying on a single month.
The Bigger Story Behind the Map
The interesting part of this map isn’t simply whether Apple or Android “wins.”
It is how differently the same technology market behaves across countries separated by only a few hundred kilometers.
In May 2026:
Denmark was around 63% iOS.
Switzerland was around 60%.
Norway was around 54%.
The UK was around 54%.
Germany was around 45%.
France was around 35%.
Spain was around 33%.
Romania was around 31%.
Türkiye was around 26%. (StatCounter Global Stats)
That is an enormous range.
And it shows how smartphone choice is influenced not only by technology but also by economics, purchasing habits, pricing and local consumer culture.
Two Europeans can live only a short flight apart yet exist in very different smartphone ecosystems.
Accuracy Note for the Infographic
I would not publish the current version unchanged. The source attribution is appropriate, but several country values appear to have been mixed with another dataset or period.
The clearest corrections from StatCounter’s May 2026 mobile OS data are:
- Denmark: 63.42%, not 49.6%
- France: 34.99%, not 48.2%
- Spain: 32.66%, not 39.6%
- Romania: 31.23%, not 24.3%
Switzerland 59.69%, Norway 54.33%, UK 53.50%, Germany 44.89%, and Türkiye 25.50% are correct or essentially correct. (StatCounter Global Stats)