
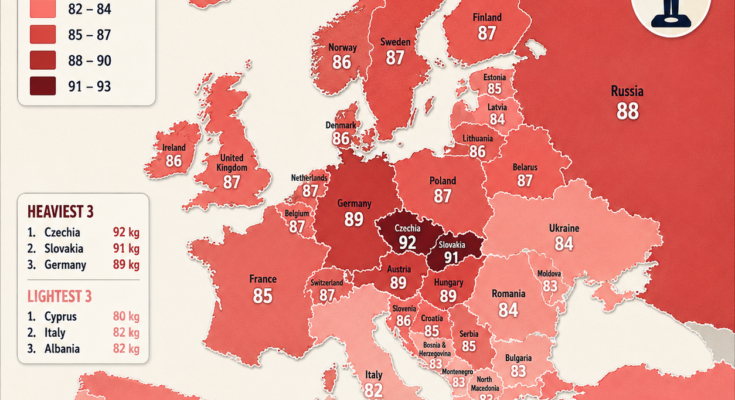
Put the average European man on a scale and the number changes surprisingly quickly depending on which side of the continent he comes from.
The infographic shows values ranging from roughly 80 kg in Cyprus to more than 90 kg in parts of Central Europe, with Czechia and Slovakia appearing near the top and Mediterranean countries generally toward the lower end.
At first glance, this looks like a map of which European countries are “heaviest.”
But average body weight is more complicated than that.
A country’s mean weight reflects not only body fat, but also height, age structure, muscle mass, diet, physical activity and the way the underlying survey was conducted.
Two populations could have very different average weights while having similar levels of body fat.
That makes this map interesting—but it also means it should not be interpreted as a simple map of health.
First: What Does “Average Male Weight” Actually Mean?
If researchers weigh a representative sample of adult men and calculate the arithmetic mean, they obtain an average body weight.
Suppose five men weigh:
70 kg, 75 kg, 80 kg, 85 kg and 90 kg.
Their average is 80 kg.
National surveys attempt to do the same thing with thousands of people and statistical weighting designed to represent the broader population.
The difficulty is that different European surveys do not always measure exactly the same population.
One survey may cover people aged 18 and older.
Another may cover ages 25–64.
One may physically measure participants.
Another may ask people to report their own height and weight.
One may have been conducted in 2019.
Another may have fresh data from 2025.
Those details can change the result substantially.
That is why a continental ranking compiled from different national studies needs to be described as approximate.
Czechia: Why 92 kg Appears at the Top
The infographic places Czechia first at around:
92 kg.
There is real evidence supporting a figure close to this, but the context matters.
A Czech cardiovascular-health study measured men aged 25–64 in six districts over several decades. In 2016/17, their average weight reached:
92.1 kg
with an average height of about 177.7 cm and mean BMI of 29.2. (PubMed Central (PMC))
The increase was substantial.
The same research program had recorded average male weight of only about:
81.7 kg in 1985.
So within that study population, average male weight rose by more than 10 kg over roughly three decades. (PubMed Central (PMC))
A later Czech examination survey also found a mean male BMI of 28.3 kg/m² among adults aged 25–64, with 77% of men above the normal BMI range. (SZÚ)
That suggests the relatively high Czech value is not simply a mapping accident.
However, saying:
“The average Czech man weighs 92 kg”
is stronger than the available evidence supports unless a truly national, all-adult survey with the same definition is cited.
A more accurate statement is:
Some recent measured Czech adult-male samples have averaged around 92 kg.
Slovakia and Central Europe
The map puts neighboring Slovakia at about 91 kg, followed by countries such as Germany, Austria and Hungary around the upper 80s.
This creates an obvious Central European cluster.
Several forces may contribute.
Men in this part of Europe are relatively tall.
Traditional diets can be calorie-dense.
Overweight prevalence among men is also substantial.
Eurostat’s 2019 European Health Interview Survey found that men were more likely than women to be overweight in every EU member state covered, and Czechia had one of the largest sex gaps. (European Commission)
But even here, weight alone cannot tell us which factor contributes most.
Germany Shows Why Fresh Data Matter
The infographic gives Germany:
89 kg.
But Germany now has much newer official information.
According to Germany’s Federal Statistical Office, the average adult man in 2025 was:
1.79 meters tall
and
86.5 kilograms.
The average adult woman was 1.66 m and 69.7 kg. (Destatis)
Germany’s official survey also found that 62.6% of adult men had a BMI of at least 25, while 19.9% had BMI of at least 30. (Destatis)
So Germany is still relatively heavy in European terms, but the infographic’s 89 kg value is no longer the best current figure.
This demonstrates why labels such as “latest estimates” can be dangerous on maps.
A number may have been correct for one survey year and become outdated when a new national health survey is released.
Why Taller Countries Naturally Weigh More
This may be the most important issue when interpreting the map.
Imagine two men with exactly the same body proportions.
One is 1.68 m tall.
The other is 1.85 m.
The taller man should naturally weigh substantially more simply because he has a larger body.
That does not automatically make him less healthy.
Body mass index attempts to account for this by dividing weight by height squared:
BMI = weight in kilograms ÷ height² in meters.
WHO uses BMI primarily as a screening indicator for population comparisons, defining overweight in adults as BMI of 25 or above and obesity as BMI of 30 or above. WHO also stresses that BMI is a surrogate marker rather than a direct measurement of body fat. (World Health Organization)
This matters enormously for Europe because average male height varies geographically too.
Countries with tall populations can naturally appear heavier on a kilogram map.
Northern Europe: Heavy Without Necessarily Leading in Obesity
The Nordic countries sit mostly in the mid-to-upper 80 kg range on the infographic:
Norway around 86 kg,
Sweden around 87,
Finland around 87,
Denmark around 86,
and Iceland around 86.
Part of that reflects height.
Northern European male populations are among the taller populations globally.
So a Norwegian man weighing 86 kg at a relatively tall height may have a very different body composition from a shorter man weighing the same amount elsewhere.
This is why:
weight ≠ obesity.
The latest NCD-RisC analysis, published in Nature in 2026, used BMI and obesity prevalence, rather than raw mean weight, for international health comparisons. It analyzed 4,050 population-based studies with measured height and weight from 232 million participants across 200 countries. (Nature)
That is the better approach if the question is health rather than literal kilograms.
Britain and Ireland
The infographic places the United Kingdom around 87 kg and Ireland around 86 kg.
These countries are interesting because high body weight is not explained by height alone.
The WHO European Region has long reported high levels of overweight and obesity, and the United Kingdom sits toward the higher end among wealthy Western European countries in recent international analyses.
NCD-RisC’s 2026 study found that adult obesity prevalence in high-income Western Europe generally remained below 25% in 2024, but rates in high-income English-speaking countries such as the UK were higher, in roughly the 25–43% range. (Nature)
So Britain’s position on a weight map likely reflects a combination of both:
relatively large body size
and
higher levels of excess body fat.
France Is Noticeably Lighter
France appears at approximately:
85 kg.
That puts it below Germany, the Netherlands and much of Central Europe.
France is particularly interesting because recent international research suggests its obesity prevalence is comparatively low among high-income countries.
The 2026 NCD-RisC analysis estimated adult obesity prevalence in France at around 11% in 2024, among the lowest levels mentioned for wealthy Western European countries. (Nature)
Again, that does not mean every French person is thin.
National averages hide enormous differences by:
age,
income,
education,
region
and occupation.
But France’s relatively modest weight on the map is broadly consistent with its lower obesity prevalence compared with several northern and central European countries.
Italy and the Mediterranean Pattern
Italy appears near the light end at roughly:
82 kg.
Portugal is also shown around 82 kg.
Spain is around 83.
Greece around 83.
This creates a recognizable southern European pattern.
Several things may contribute.
Men tend to be somewhat shorter on average than in the Netherlands, Germany or Scandinavia.
Traditional Mediterranean eating patterns also historically emphasized:
vegetables,
legumes,
fish,
fruit,
olive oil
and relatively modest portions of meat.
But it would be a mistake to explain the map with diet alone.
Modern Italian, Spanish and Portuguese diets are changing.
Processed foods are widespread.
Physical activity differs by age and social group.
And obesity is certainly present throughout southern Europe.
Eurostat’s 2019 data did, however, find Italy had the lowest overall share of overweight adults in the EU, at about 46%, with France close behind at 47%. (European Commission)
That helps explain why southern and western Europe can appear somewhat lighter than parts of Central Europe.
Cyprus Shows Why This Particular Map Needs Updating
Cyprus is labeled as the lightest country at:
80 kg.
But a recent Cypriot National Dietary Survey reports a different figure.
It found an average adult male height of:
174.6 cm
and average male weight of:
83.9 kg.
Average male BMI was approximately 27.5 kg/m². (Child Health)
That means Cyprus probably should not be ranked at 80 kg if this newer national survey is being used.
This is another reason I would avoid publishing a “heaviest three / lightest three” ranking unless every country is drawn from the same standardized dataset and age range.
A difference of only two or three kilograms can disappear simply because one survey is newer or sampled a different age group.
Age Can Shift National Averages
Men typically do not weigh exactly the same throughout adulthood.
Germany’s latest statistics demonstrate the pattern clearly.
Younger adults are generally lighter.
Weight rises into middle age.
It then tends to decrease again among older adults.
Germany’s total population data found adults aged 18–24 averaged about 72.5 kg across both sexes, while people aged 50–59 averaged about 81.3 kg. (Destatis)
So imagine two otherwise similar countries.
Country A has a very young population.
Country B has a large concentration of middle-aged adults.
Their average weights could differ even if people of the same age had nearly identical body size.
A rigorous comparison therefore needs either:
identical age groups
or
age-standardized values.
That is one major reason epidemiologists often prefer age-standardized BMI rather than simple national mean weight.
Self-Reported Weight Creates Another Problem
Some European surveys physically measure people.
Others ask:
“How much do you weigh?”
Those approaches are not equivalent.
Germany’s latest Microcensus figures, for example, are based on self-reported height and weight. The German statistical office explicitly notes this in its methodology. (Destatis)
Czech health research demonstrated why this matters.
In the Czech EHES examination study, researchers compared self-reported measurements with actual measurements and found that self-reported BMI was more than two BMI units lower than measured BMI for about 20% of respondents. (SZÚ)
People can:
underestimate their weight,
overestimate their height,
or simply not know their current measurements.
Mixing measured surveys with self-reported surveys can therefore distort international rankings.
A Heavier Average Does Not Mean an Unhealthier Population
This is the distinction I would emphasize most strongly in the article.
Body weight includes:
- fat
- muscle
- bone
- organs
- water
- the effect of overall body size and height
A country with tall, muscular men might have a higher average weight without having greater obesity.
Likewise, two countries with identical mean weight could have very different health profiles if their populations differ substantially in height and body composition.
WHO therefore does not diagnose overweight or obesity from kilograms alone. It uses height-adjusted measures such as BMI, while recognizing that additional measurements such as waist circumference can provide more information. (World Health Organization)
What the Map Is Still Good At Showing
Despite these limitations, the map communicates one real fact very effectively:
Male body size is not distributed uniformly across Europe.
There does appear to be a broad pattern in which parts of Central, Northern and Eastern Europe have heavier male populations, while several Mediterranean populations average somewhat less.
But the reasons overlap.
Height matters.
Obesity prevalence matters.
Age matters.
Diet and physical activity matter.
Population genetics and body build matter.
And survey methodology matters.
That makes this less a map of who “eats the most” and more a map of how human body size varies across populations.
Why European Body Weight Has Changed
The Czech long-term measurements provide a particularly dramatic example of how quickly national body size can change.
Men in the monitored Czech population increased from about 81.7 kg in 1985 to 92.1 kg in 2016/17. (PubMed Central (PMC))
Genetics did not change that quickly.
The environment did.
Over several decades Europe experienced enormous shifts in:
food availability,
portion sizes,
transportation,
sedentary employment,
screen time,
urban lifestyles
and opportunities for physical activity.
Across the WHO European Region, about 59% of adults were living with overweight or obesity according to the organization’s major regional assessment. (World Health Organization)
More recent NCD-RisC evidence is nuanced: obesity increases have slowed or plateaued in several high-income European populations, but levels remain substantial and trends differ considerably from country to country. (Nature)
The Better Map Would Show BMI Beside Weight
If this infographic were expanded, the most useful companion visualization would be:
Average male weight + average male height + age-standardized BMI.
Then the reader could distinguish between countries that are heavy mainly because men are tall and countries where elevated weight is more strongly associated with high BMI.
Waist circumference would add another useful measure.
That would turn a visually interesting map into a genuinely powerful population-health comparison.
Final Thought
A few kilograms may separate the average man in one European country from another, but those numbers contain far more information than they initially appear to.
They reflect:
human height,
age,
body composition,
diet,
physical activity,
economic development
and decades of changing lifestyles.
The biggest lesson is therefore not that Czech men are “heavy” while Italian men are “light.”
It is that body weight without context tells only part of the story.
For comparing actual health risk, weight should always be considered alongside height, BMI, waist circumference and other measures.
And for comparing countries, the same age ranges and measurement methods matter just as much as the number on the scale.
Accuracy Note for the Infographic
I would not publish the current version unchanged. The concept works, but the subtitle “latest comparable public estimates” is too strong when the figures are compiled from surveys with different years, age ranges and measurement methods.
The most obvious revisions are:
Germany: change 89 kg to approximately 86.5 kg based on the official 2025 adult Microcensus. (Destatis)
Cyprus: reconsider 80 kg; the National Dietary Survey reports approximately 83.9 kg for adult men. (Child Health)
Czechia: 92 kg is supported by a measured 2016/17 study, but that study covered 25–64-year-old men in six districts, so it should not be presented as a perfectly comparable all-adult national figure. (PubMed Central (PMC))
I would change the footer to:
“Sources: national health and examination surveys from varying years. Values are approximate and are not fully age-standardized or methodologically identical across countries. WHO/NCD-RisC BMI data used only for contextual comparison.”
That makes the map much more defensible.